Ann Pediatr Endocrinol Metab Search

CLOSE


Ann Pediatr Endocrinol Metab > Volume 28(2); 2023 > Article
Choe, Kim, and Moon: Cutoff values of body mass index for severe obesity in Korean children and adolescents: the 99th percentile versus 120% of the 95th percentile

Abstract

Purpose

Several definitions for severe obesity have been used, primarily the 99th percentile of the body mass index (BMI) and 120% of the 95th BMI percentile. This study aimed to establish a standardized definition for severe obesity in children and adolescents in Korea.

Methods

The 99th BMI percentile line and 120% of the 95th BMI percentile line were constructed using 2017 Korean National Growth Charts. To compare these 2 cutoff points for severe obesity, we included 9,984 individuals (5,289 males and 4,695 females) aged 10–18 years with anthropometric data available from the Korean National Health and Nutrition Examination Survey 2007–2018.

Results

Although 120% of the 95th percentile of BMI is widely used as a definition of severe obesity, the 99th percentile is almost identical to 110% of the 95th percentile in Korea, according to the latest national BMI growth chart for children and adolescents. The prevalence rates of high blood pressure, high triglycerides, low high-density lipoprotein cholesterol, and high alanine aminotransferase in the participants whose BMI was ≥120% of the 95th percentile were higher than in those whose BMI was ≥99th percentile (P<0.001).

Conclusions

A cutoff value for severe obesity of ≥120% of the 95th percentile is appropriate in children and adolescents in Korea. To provide follow-up care for severely obese children and adolescents, it is necessary to add a new line at 120% of the 95th percentile to the national BMI growth chart.

Highlights

· The 99th percentile and 120% of the 95th percentile of BMI are both used as severe obesity criteria for children and adolescents in Korea. Our analysis found that the 120% of the 95th percentile BMI line reflected the cardiometabolic risk factors better than the 99th percentile line. A cutoff value for severe obesity of ≥120% of the 95th percentile is appropriate in children and adolescents in Korea.

Introduction

The prevalence of obesity is rising worldwide in both adult and pediatric populations [1], and it is also increasing rapidly in Korea [2]. Pediatric obesity is defined as a body mass index (BMI) higher than the 95th percentile for the corresponding age and sex. Reference values for different populations are used to diagnose this condition [3,4].
It is noteworthy that a recent increase in the global prevalence of severe obesity has also been reported [5], a phenomenon that is likewise occurring in Korea [6]. Recent studies suggest that young individuals with severe obesity tend to have increased cardiometabolic risk factors (CMRFs) and are more likely to develop long-term complications than children who are merely obese or overweight [7-11]. Several studies have revealed that severe obesity in pediatric populations is associated with hypertension, dysglycemia, dyslipidemia, and metabolic syndrome [12,13].
Accordingly, attention has been paid to obesity classification with further stratification, and the most commonly used criteria for severe obesity are the 99th percentile and 120% of the 95th percentile of BMI. In Korea, those 2 standards are used in combination [14,15]. Therefore, it is necessary to establish a standardized definition of severe obesity in children and adolescents in Korea. In this study, based on the 2017 Korean National Growth Charts for children, we compared the 99th percentile of BMI with 120% of the 95th BMI percentile to determine which of the 2 standards is a more suitable definition of severe obesity.

Materials and methods

1. Growth chart construction

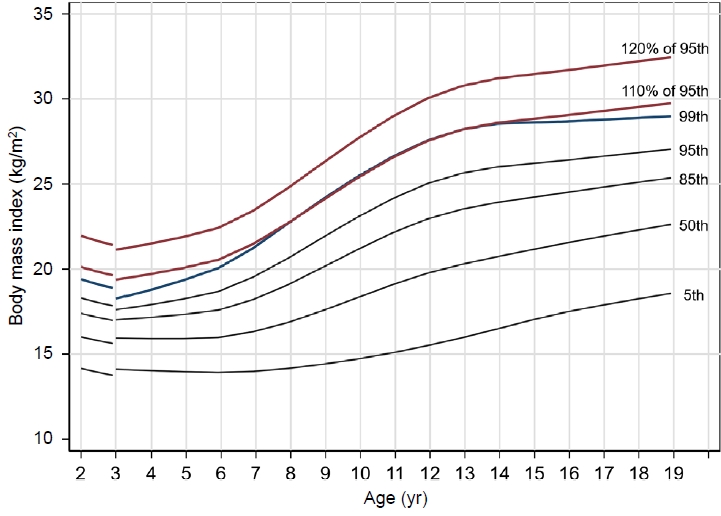
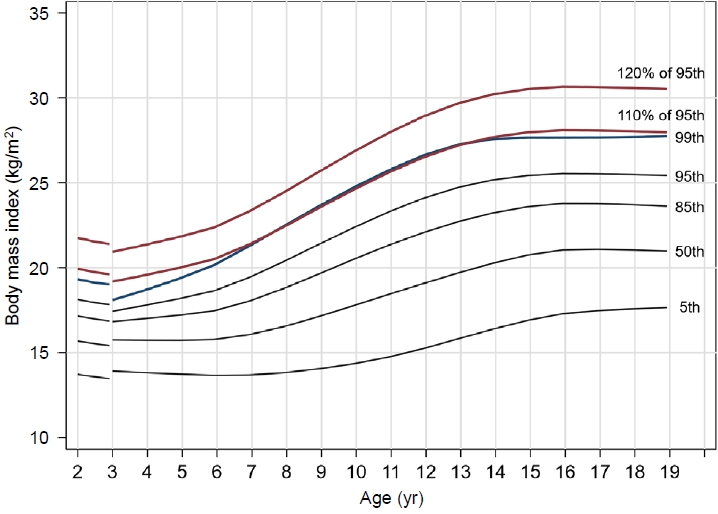
To compare the optimal cutoff points for identifying severe obesity, the BMI 99th percentile line and 120% of the BMI 95th percentile line were constructed using the 2017 Korean National Growth Charts [4].

2. Ethical statement

The Institutional Review Board of the Korean Centers for Disease Control and Prevention approved the Korean National Health and Nutrition Examination Survey (KNHANES) protocol (2007-02CON-04-P, 2008-04EXP-01-C, 2009-01CON-03-2C, 2010-02CON-21-C, 2011-02CON-06-C, 2012-01EXP-01-2C, 2013-07-CON-03-4C, and 2013-12EXP-03-5C). Since 2015, KNHANES protocols have been exempted from review by ethics committees in favor of the public interest. This study was approved by the Institutional Review Board of Seoul National University Bundang Hospital (X-2203-742-902).

3. Study participants

To compare the 2 cutoff points for severe obesity, we used data from KNHANES 2007–2018. KNHANES is a nationally representative cross-sectional survey that has been conducted since 1998 by the Korean Centers for Disease Control and Prevention. This national survey uses a stratified, multistage, clustered probability sampling design to represent noninstitutionalized citizens in Korea. The methods used for data collection in KNHANES, including health interviews, nutrition surveys, and health examinations, have been described in detail in a previous study [16].
Among the 97,662 people who participated in KNHANES between 2007 and 2018, 9,984 individuals (5,289 boys and 4,695 girls) aged 10–18 years with anthropometric data were included in this study after excluding those with missing data on blood pressure (BP), fasting glucose, triglycerides, high-density lipoprotein cholesterol (HDL-C), or alanine aminotransferase (ALT). Participants who fasted for <8 hours before their blood draw and those who were pregnant were also excluded.

4. Anthropometric measurements and laboratory tests

Trained medical personnel performed anthropometric measurements, including measurement of height and weight. Height was measured to the nearest 0.1 cm using a portable stadiometer (Seca 225, Seca, Hamburg, Germany). Weight was measured to the nearest 0.1 kg using an electronic balance (GL-6000-20; G-tech, Seoul, Korea). BMI was calculated as weight (kg) divided by height squared (m2). BP was measured 3 times on the right arm using a mercury sphygmomanometer with a cuff appropriate for each participant's arm circumference after allowing the participant to rest for at least 5 min in a sitting position (Baumanometer Desk Model 0320 in 2007–2012 and Baumanometer Wall Unit 33 (0850) in 2013–2018; W.A. Baum, Copiague, NY, USA). The average BP values from the second and third measurements were used in the analyses.
Blood samples were drawn by trained medical personnel and transported to a central laboratory within 24 hours of sampling. Plasma glucose, HDL-C, triglyceride, and ALT levels were measured using a Hitachi Automatic Analyzer 7600 (Hitachi, Tokyo, Japan).

5. Definitions of severe obesity and CMRFs

The degree of obesity was categorized based on the BMI percentile adjusted for the corresponding sex and age using the 2017 Korean National Growth Charts [4]: normal weight (BMI <95th percentile) and obesity (BMI ≥95th percentile). Severe obesity was classified according to 2 different criteria: BMI ≥99th percentile and BMI ≥120% of the 95th percentile.
The definitions of abnormal CMRFs were as follows: HDL-C <40 mg/dL, triglycerides ≥150 mg/dL, fasting glucose ≥100 mg/ dL, ALT ≥26 IU/L for males and ≥22 IU/L for females [17], and systolic BP ≥95th percentile or diastolic BP ≥95th percentile adjusted by age, sex, and height [18].

6. Statistical analyses

Statistical analyses were performed using Stata 16.1 (StataCorp LP, College Station, TX, USA). Stata svy commands and appropriate sample weights were applied to all the analyses. Chi-square tests were used to compare proportions between groups. Multiple logistic regression analyses were performed to estimate sex- and age-adjusted odds ratios (ORs) with 95% confidence intervals (CIs) for associations between CMRFs and the degree of obesity using different criteria. Statistical significance was set at P<0.05.

Results

1. Prevalence of severe obesity based on different criteria

Among the study participants, the difference in prevalence according to the criteria for severe obesity was as follows: Based on the BMI 99th percentile criterion, 89.9% of participants had a BMI <95th percentile; 5.6% had a BMI between the 95th and <99th percentiles; and 4.6% had a BMI ≥99th percentile. Based on the criterion of 120% of the BMI 95th percentile, 89.9% of the participants had a BMI <95th percentile, 7.7% had a BMI between the 95th and <120% of the 95th percentiles, and 2.4% had a BMI ≥120% of the 95th percentile.

2. BMI curves using the 99th percentile and 120% of the 95th percentile lines

BMI percentile lines were constructed using the 2017 Korean National Growth Charts [4]. Figs. 1 and 2 show the results for males and females, respectively. Both figures show that the BMI 99th percentile line tended to be almost identical to 110% of the 95th percentile line.

3. Comparison of CMRFs associated with severe obesity based on different criteria

Table 1 shows the prevalence of CMRFs associated with severe obesity according to the different criteria. The prevalence of high BP was 22.3% in the BMI ≥99th percentile group (OR, 5.4; P<0.001) and 26.7% (OR, 8.4; P<0.001) in the BMI ≥120% of the 95th percentile group. Both of those were significantly higher than the prevalence of 5.5% in the population with a normal BMI. Similar results were found for the prevalence of high triglycerides, low HDL-C, and high ALT levels. The prevalence of high triglycerides in the participants with a BMI ≥120% of the 95th percentile was significantly higher than that in those with a BMI ≥99th percentile (OR 5.7 vs. 4.7, respectively, P<0.001), and similar findings were observed for low HDL-C (OR 5.4 vs. 4.3, respectively, P<0.001) and high ALT (OR, 9.4 vs. 6.4, respectively; P<0.001) (Table 1). However, the results were different for the prevalence of high blood glucose, which affected 15.8% of the participants with a BMI ≥99th percentile, 7.1% of those with a normal BMI (OR, 2.7; P<0.001), and 13.7% of those with a BMI ≥120% of the 95th percentile (OR, 2.3; P<0.001). These results were consistent when they were analyzed separately for males and females (Supplementary Table 1 and 2).
BMI was further categorized as <85th, 85th to <95th, 95th to <99th, 99th to <120% of 95th, and ≥120% of the 95th percentile (Table 2). The adjusted ORs for CMRFs increased sharply in the 99th to <120% of the 95th percentile and ≥120% of the 95th percentile groups. In a post-hoc analysis, the prevalence of high BP, high triglycerides, low HDL-C, and high ALT was significantly higher in the group with a BMI ≥120% of the 95th percentile than in the group with a BMI between the 99th percentile and <120% of the 95th percentile (data not shown).

Discussion

This study evaluated the appropriateness of competing criteria used to define severe obesity. To the best of our knowledge, this is the first study conducted based on reference values from a Korean population. In the United States, the 99th percentile BMI line and 120% of the 95th percentile BMI line were similar [19]. However, in Korea, the 99th percentile BMI line was almost identical to the 110% of the 95th percentile BMI line.
In this study, the prevalence of high BP, high triglycerides, low HDL-C, and high ALT in the participants whose BMI was ≥120% of the 95th percentile was significantly higher than in the participants whose BMI was ≥99th percentile. Furthermore, the 120% of the 95th percentile BMI line reflected the CMRFs better than the 99th percentile line.
Severe obesity affects 4%–6% of all children and adolescents in the United States and is associated with short- and long-term health problems [7,19-22]. Previous studies suggest that young individuals with severe obesity have much more adverse CRMF profiles than overweight and obese children and adolescents, which leads to vascular dysfunction and atherosclerosis [7-11]. High BMI levels in children and adolescents are also associated with an increased risk of cardiometabolic diseases such as stroke, diabetes, and premature mortality [23-28]. Many common treatments that are effective in overweight and obese children and adolescents are ineffective in children with severe obesity [29-31]. Therefore, to alter the health trajectory of children and adolescents suffering from this disease, it is necessary to distinguish between patients with severe obesity and those who are obese or overweight, and new treatment strategies for severely obese patients should be adopted.
Although several definitions for severe obesity have been proposed in children and adolescents, the criteria of BMI ≥99th percentile has been most common [32]. In 2007, an expert committee convened by the American Medical Association, the Centers for Disease Control and Prevention (CDC), and the Department of Health and Human Services proposed a new classification of severe childhood obesity, which consisted of BMI values at ages of 5–17 years ≥99th percentile [31]. This classification was based on data from the National Health and Nutrition Examination Survey 1999–2004 [7,33]. Freedman et al. [7] suggested that a BMI ≥99th percentile corresponded to a subgroup of obese children and adolescents who went on to have high rates of obesity and morbid obesity in adulthood, a high prevalence of cardiovascular risk factors, and high levels of adiposity, as indicated by serum cholesterol and triglyceride levels, as well as high BP. However, worsening deviation, as shown by the Lambda-Mu-Sigma parameters, means that the statistical performance of an index declines as the percentile rises; therefore indiscriminate adoption of this particular BMI percentile cutoff should be avoided.
In 2009, Flegal et al. [19] suggested an alternative method for calculating extreme BMI values derived from the CDC reference growth charts for the United States. The 2000 CDC BMI growth charts smoothed the percentiles up to the 97th percentile [34] because BMI percentiles above that point were outside the limits of the reference dataset [35]. Flegal et al. [19] claimed that expressing a high BMI value as a percentage of the 95th percentile was a potential approach that could help classify the 99th percentile and provide a flexible way to describe and track very heavy young people. Using that approach, they found that 120% of the 95th BMI percentile adjusted for age was comparable to the unsmoothed 99th percentile in the growth chart dataset. Gulati et al. [36] demonstrated the utility of using a percentage above the 95th percentile to track young patients who are severely obese.
Because the extreme values in the BMI distribution are not accurate, assigning a precise z-score or percentile might be less accurate than recording changes in BMI over time. In other words, substantial weight fluctuations can cause subtle changes in percentile and z-score values at the extreme ends of the curve, and it might be difficult to interpret those mild changes clinically [32].
Although 120% of the 95th percentile of BMI is used as a definition of severe obesity worldwide, the 99th percentile is almost identical to 110% of the 95th percentile in Korea, according to the latest Korean BMI growth charts for children and adolescents. The reason for this difference from other countries might be that other countries have higher reference BMI values for obesity. For example, in the 2000 CDC BMI growth chart, 120% of the 95th percentile and the 99th percentile of BMI for 10-year-5-month-old males were 29 kg/m2 and 29.3 kg/m2, respectively. In the BMI charts for 10-year-5-month-old males in Korea, 120% of the 95th percentile was 28.3 kg/m2, and the 99th percentile was 26 kg/m2.
It seems reasonable to follow the standards commonly used in guidelines worldwide. In this study, the characteristics of children and adolescents with a BMI in the 95th to <99th percentile were similar to those of children with a BMI in the 99th to 120% of the 95th percentile (Table 2). In addition, the adjusted ORs for CMRFs increased sharply between 99th to <120% of the 95th percentile BMI group and the ≥120% of 95th percentile BMI group. Moreover, to compare epidemiological obesity data between countries and further classify severe obesity into categories, such as class III obesity for people with a BMI ≥140% of the 95th percentile, it would be best to use 120% of the 95th percentile as the standard for severe obesity in Korea. Therefore, adding a new line at 120% of the 95th percentile to the BMI chart in Korea could be clinically useful [36].
This study used data from KNHANES, and therefore it has the limitations of requiring additional clinical observations because we did not clinically analyze actual patients. Nonetheless, this is the first study to investigate the suitability of criteria for severe obesity using the latest growth chart for children and adolescents in Korea.
In conclusion, it is appropriate to set the cutoff value for severe obesity in children and adolescents in Korea to ≥120% of the BMI 95th percentile line. Moreover, to provide follow-up care to obese children and adolescents, it is necessary to add new lines to the national BMI charts, specifically at 110% and 120% of the 95th percentile at minimum. Additional research is required to evaluate the clinical appropriateness of this criterion for severe obesity through long-term follow-up observations.

Supplementary material

Supplementary Tables 1 and 2 can be found via https://doi.org/10.6065/apem.2244058.029.
Supplementary Table 1.
Prevalence of cardiometabolic risk factors for severe obesity using the 120% of 95th percentile of the body mass index
apem-2244058-029-Supplementary-Table-1-2.pdf
Supplementary Table 2.
Prevalence of cardiometabolic risk factors for severe obesity using the 99th percentile of the body mass index
apem-2244058-029-Supplementary-Table-1-2.pdf

Notes

Conflicts of interest

No potential conflict of interest relevant to this article is reported.

Funding

This study received no specific grant from any funding agency in the public, commercial, or not-for-profit sectors.

Data availability

The data that support the findings of this study can be provided by the corresponding author upon reasonable request.

Author contribution

Conceptualization: JK; Data curation: JK; Formal analysis: JK, JSM; Funding acquisition: JK; Methodology: JK, JSM; Project administration: JK; Visualization: JK; Writing - original draft: JC; Writing - review & editing: JC, JK, JSM

Fig. 1.
Body mass index percentiles by age: males from 2 to 19 years.
apem-2244058-029f1.jpg
Fig. 2.
Body mass index percentiles by age: females from 2 to 19 years.
apem-2244058-029f2.jpg
Table 1.
Prevalence of cardiometabolic risk factors using different criteria for severe obesity
Cardiometabolic risk factor BMI cutoff of 99th percentile
BMI cutoff of 120% of 95th percentile
BMI category No. Prevalence (%) (95% CI) Odds ratio (95% CI) P-value BMI category No. Prevalence (%) (95% CI) Odds ratio (95% CI) P-value
High blood pressure (N=9,984) <95th 492 5.5 (4.9–6.1) Ref. - <95th 492 5.5 (4.9–6.1) Ref. -
95th to <99th 74 13.5 (10.7–17.0) 2.7 (2.0–3.7) <0.001 95th to <120% of 95th 101 13.8 (11.2–16.9) 2.8 (2.2–3.7) <0.001
≥99th 85 22.3 (18.1–27.2) 5.4 (4.1–7.2) <0.001 ≥120% of 95th 58 26.7 (23.1–37.2) 8.4 (5.8–12.1) <0.001
High blood glucose (N=8,517) <95th 548 7.1 (6.4–7.9) Ref. - <95th 548 7.1 (6.4–7.9) Ref. -
95th to <99th 45 10.0 (7.2–13.9) 1.4 (1.0–2.2) 0.047 95th to <120% of 95th 73 12.2 (9.5–15.6) 1.9 (1.4–2.5) <0.001
≥99th 52 15.8 (11.8–20.7) 2.7 (1.9–3.9) <0.001 ≥120% of 95th 24 13.7 (8.7–20.9) 2.3 (1.3–4.0) 0.002
High triglyceride (N=8,549) <95th 549 7.1 (6.4–7.8) Ref. - <95th 549 7.1 (6.4–7.8) Ref. -
95th to <99th 103 21.0 (17.2–25.4) 3.5 (2.7–4.6) <0.001 95th to <120% of 95th 139 21.2 (17.9–25.0) 3.6 (2.9–4.6) <0.001
≥99th 86 24.9 (19.9–30.6) 4.7 (3.5–6.4) <0.001 ≥120% of 95th 50 27.8 (20.8–36.1) 5.7 (3.8–8.5) <0.001
Low HDL cholesterol (N=8,547) <95th 841 10.6 (9.8–11.5) Ref. - <95th 841 10.6 (9.8–11.4) Ref. -
95th to <99th 127 25.4 (21.2–30.1) 2.9 (2.2–3.7) <0.001 95th to <120% of 95th 178 26.1 (22.3–30.3) 3.0 (2.4–3.8) <0.001
≥99th 128 34.8 (29.3–40.8) 4.3 (3.3–5.7) <0.001 ≥120% of 95th 77 41.4 (33.5–49.8) 5.4 (3.7–7.9) <0.001
High alanine aminotransferase (N=9,984) <95th 1,624 18.6 (17.6–19.7) Ref. - <95th 1,624 18.6 (17.6–19.7) Ref. -
95th to <99th 217 39.5 (34.8–44.4) 2.9 (2.4–3.5) <0.001 95th to <120% of 95th 314 41.6 (37.5–45.9) 3.2 (2.7–3.8) <0.001
≥99th 235 57.6 (51.9–63.0) 6.4 (5.1–8.2) <0.001 ≥120% of 95th 138 66.1 (58.5–73.0) 9.4 (6.6–13.2) <0.001

BMI, body mass index; CI, confidence interval; HDL, high-density lipoprotein.

Adjusted for age and sex.

Table 2.
Prevalence and odd ratio of cardiometabolic risk factors by body mass index categories
Cardiometabolic risk factor BMI category No. Prevalence (%) (95% CI) Odds ratio (95% CI) P-value
High blood pressure (N=9,984) <85th 398 4.9 (4.4–5.5) Ref. -
85th to <95th 94 10.6 (8.3–13.3) 2.3 (1.7–3.0) <0.001
95th to <99th 29 14.2 (11.2–16.9) 3.4 (2.5–4.2) <0.001
99th to <120% of 95th 72 13.6 (10.8–17.1) 3.1 (2.3–4.2) <0.001
≥120% of 95th 58 29.7 (23.1–37.2) 9.4 (6.5–13.7) <0.001
High blood glucose (N=8,517) <85th 455 6.8 (6.1–7.6) Ref. -
85th to <95th 93 9.7 (7.7–12.1) 1.4 (1.1–1.9) 0.009
95th to <99th 28 17.5 (11.9–24.1) 3.2 (2.0–5.1) <0.001
99th to <120% of 95th 45 10.1 (7.2–14.0) 1.5 (1.1–2.3) 0.026
≥120% of 95th 24 13.7 (8.7–20.9) 2.4 (1.4–4.2) 0.001
High triglyceride (N=8,549) <85th 422 6.1 (5.4–6.8) Ref. -
85th to <95th 127 15.5 (12.8–18.6) 2.8 (2.2–3.6) <0.001
95th to <99th 37 21.5 (15.3–29.3) 4.4 (2.9–6.8) <0.001
99th to <120% of 95th 102 21.1 (17.3–25.5) 4.2 (3.2–5.5) <0.001
≥120% of 95th 50 27.8 (20.8–36.1) 6.6 (4.4–10.0) <0.001
Low HDL cholesterol (N=8,547) <85th 674 9.5 (8.7–10.4) Ref. -
85th to <95th 167 19.3 (16.4–22.6) 2.3 (1.8–2.8) <0.001
95th to <99th 53 27.7 (20.9–35.6) 3.7 (2.5–5.3) <0.001
99th to <120% of 95th 125 25.5 (21.3–30.2) 3.3 (2.5–4.2) <0.001
≥120% of 95th 77 41.4 (33.5–49.8) 6.0 (4.2–8.8) <0.001
High alanine aminotransferase (N=9,984) <85th 1,325 17.3 (16.2–18.4) Ref. -
85th to <95th 299 30.3 (27.2–33.6) 2.1 (1.7–2.4) <0.001
95th to <99th 99 47.9 (39.9–55.9) 4.7 (3.4–6.5) <0.001
99th to <120% of 95th 215 39.1 (34.4–44.0) 3.1 (2.5–3.8) <0.001
≥120% of 95th 138 66.1 (58.5–73.0) 10.3 (7.3–14.5) <0.001

BMI, body mass index; CI, confidence interval; HDL, high-density lipoprotein.

Adjusted for age and sex.

References

1. NCD Risk Factor Collaboration (NCD-RisC). Worldwide trends in body-mass index, underweight, overweight, and obesity from 1975 to 2016: a pooled analysis of 2416 population-based measurement studies in 128.9 million children, adolescents, and adults. Lancet 2017;390:2627–42.
crossref pmid pmc
2. Kim JH, Moon JS. Secular trends in pediatric overweight and obesity in Korea. J Obes Metab Syndr 2020;29:12–7.
crossref pmid pmc
3. Styne DM, Arslanian SA, Connor EL, Farooqi IS, Murad MH, Silverstein JH, et al. Pediatric obesity-assessment, treatment, and prevention: an endocrine society clinical practice guideline. J Clin Endocrinol Metab 2017;102:709–57.
crossref pmid pmc pdf
4. Kim JH, Yun S, Hwang SS, Shim JO, Chae HW, Lee YJ, et al. The 2017 Korean National Growth Charts for children and adolescents: development, improvement, and prospects. Korean J Pediatr 2018;61:135–49.
crossref pmid pmc pdf
5. Skinner AC, Ravanbakht SN, Skelton JA, Perrin EM, Armstrong SC. Prevalence of obesity and severe obesity in US children, 1999-2016. Pediatrics 2018;141:e20173459.
crossref pmid pdf
6. Nam HK, Kim HR, Rhie YJ, Lee KH. Trends in the prevalence of extreme obesity among Korean children and adolescents from 2001 to 2014. J Pediatr Endocrinol Metab 2017;30:517–23.
crossref pmid
7. Freedman DS, Mei Z, Srinivasan SR, Berenson GS, Dietz WH. Cardiovascular risk factors and excess adiposity among overweight children and adolescents: the Bogalusa Heart Study. J Pediatr 2007;150:12–7.e2.
crossref pmid
8. Calcaterra V, Klersy C, Muratori T, Telli S, Caramagna C, Scaglia F, et al. Prevalence of metabolic syndrome (MS) in children and adolescents with varying degrees of obesity. Clin Endocrinol (Oxf) 2008;68:868–72.
crossref pmid
9. Gidding SS, Nehgme R, Heise C, Muscar C, Linton A, Hassink S. Severe obesity associated with cardiovascular deconditioning, high prevalence of cardiovascular risk factors, diabetes mellitus/hyperinsulinemia, and respiratory compromise. J Pediatr 2004;144:766–9.
crossref pmid
10. Ice CL, Murphy E, Cottrell L, Neal WA. Morbidly obese diagnosis as an indicator of cardiovascular disease risk in children: results from the CARDIAC Project. Int J Pediatr Obes 2011;6:113–9.
crossref pmid
11. Kapiotis S, Holzer G, Schaller G, Haumer M, Widhalm H, Weghuber D, et al. A proinflammatory state is detectable in obese children and is accompanied by functional and morphological vascular changes. Arterioscler Thromb Vasc Biol 2006;26:2541–6.
crossref pmid
12. Skinner AC, Perrin EM, Moss LA, Skelton JA. Cardiometabolic risks and severity of obesity in children and young adults. N Engl J Med 2015;373:1307–17.
crossref pmid
13. Kim M, Kim JH. Cardiometabolic risk factors and metabolic syndrome based on severity of obesity in Korean children and adolescents: data from the Korea National Health and Nutrition Examination Survey 2007-2018. Ann Pediatr Endocrinol Metab 2022;27:289–99.
crossref pmid pmc pdf
14. Kim BY, Kang SM, Kang JH, Kang SY, Kim KK, Kim KB, et al. 2020 Korean Society for the Study of Obesity Guidelines for the management of obesity in Korea. J Obes Metab Syndr 2021;30:81–92.
crossref pmid pmc
15. Yi DY, Kim SC, Lee JH, Lee EH, Kim JY, Kim YJ, et al. Clinical practice guideline for the diagnosis and treatment of pediatric obesity: recommendations from the Committee on Pediatric Obesity of the Korean Society of Pediatric Gastroenterology Hepatology and Nutrition. Pediatr Gastroenterol Hepatol Nutr 2019;22:1–27.
crossref pmid pmc pdf
16. Kweon S, Kim Y, Jang MJ, Kim Y, Kim K, Choi S, et al. Data resource profile: the Korea National Health and Nutrition Examination Survey (KNHANES). Int J Epidemiol 2014;43:69–77.
crossref pmid pmc
17. Vos MB, Abrams SH, Barlow SE, Caprio S, Daniels SR, Kohli R, et al. NASPGHAN clinical practice guideline for the diagnosis and treatment of nonalcoholic fatty liver disease in children: recommendations from the Expert Committee on NAFLD (ECON) and the North American Society of Pediatric Gastroenterology, Hepatology and Nutrition (NASPGHAN). J Pediatr Gastroenterol Nutr 2017;64:319–34.
crossref pmid pmc
18. Kim SH, Park Y, Song YH, An HS, Shin JI, Oh JH, et al. Blood Pressure reference values for normal weight korean children and adolescents: data from The Korea National Health and Nutrition Examination Survey 1998-2016: The Korean Working Group of Pediatric Hypertension. Korean Circ J 2019;49:1167–80.
crossref pmid pmc pdf
19. Flegal KM, Wei R, Ogden CL, Freedman DS, Johnson CL, Curtin LR. Characterizing extreme values of body mass index-for-age by using the 2000 Centers for Disease Control and Prevention growth charts. Am J Clin Nutr 2009;90:1314–20.
crossref pmid
20. Skelton JA, Cook SR, Auinger P, Klein JD, Barlow SE. Prevalence and trends of severe obesity among US children and adolescents. Acad Pediatr 2009;9:322–9.
crossref pmid pmc
21. Claire Wang Y, Gortmaker SL, Taveras EM. Trends and racial/ethnic disparities in severe obesity among US children and adolescents, 1976-2006. Int J Pediatr Obes 2011;6:12–20.
crossref
22. Koebnick C, Smith N, Coleman KJ, Getahun D, Reynolds K, Quinn VP, et al. Prevalence of extreme obesity in a multiethnic cohort of children and adolescents. J Pediatr 2010;157:26–31.e2.
crossref pmid pmc
23. Baker JL, Olsen LW, Sorensen TI. Childhood body-mass index and the risk of coronary heart disease in adulthood. N Engl J Med 2007;357:2329–37.
crossref pmid pmc
24. Bessonova L, Marshall SF, Ziogas A, Largent J, Bernstein L, Henderson KD, et al. The association of body mass index with mortality in the California Teachers Study. Int J Cancer 2011;129:2492–501.
crossref pmid pmc
25. Franks PW, Hanson RL, Knowler WC, Sievers ML, Bennett PH, Looker HC. Childhood obesity, other cardiovascular risk factors, and premature death. N Engl J Med 2010;362:485–93.
crossref pmid pmc
26. Ma J, Flanders WD, Ward EM, Jemal A. Body mass index in young adulthood and premature death: analyses of the US National Health Interview Survey linked mortality files. Am J Epidemiol 2011;174:934–44.
crossref pmid
27. Park MH, Falconer C, Viner RM, Kinra S. The impact of childhood obesity on morbidity and mortality in adulthood: a systematic review. Obes Rev 2012;13:985–1000.
crossref pmid
28. Tirosh A, Shai I, Afek A, Dubnov-Raz G, Ayalon N, Gordon B, et al. Adolescent BMI trajectory and risk of diabetes versus coronary disease. N Engl J Med 2011;364:1315–25.
crossref pmid pmc
29. Johnston CA, Tyler C, Palcic JL, Stansberry SA, Gallagher MR, Foreyt JP. Smaller weight changes in standardized body mass index in response to treatment as weight classification increases. J Pediatr 2011;158:624–7.
crossref pmid
30. Savoye M, Nowicka P, Shaw M, Yu S, Dziura J, Chavent G, et al. Long-term results of an obesity program in an ethnically diverse pediatric population. Pediatrics 2011;127:402–10.
crossref pmid pmc pdf
31. Danielsson P, Kowalski J, Ekblom O, Marcus C. Response of severely obese children and adolescents to behavioral treatment. Arch Pediatr Adolesc Med 2012;166:1103–8.
crossref pmid
32. Kelly AS, Barlow SE, Rao G, Inge TH, Hayman LL, Steinberger J, et al. Severe obesity in children and adolescents: identification, associated health risks, and treatment approaches: a scientific statement from the American Heart Association. Circulation 2013;128:1689–712.
crossref pmid
33. Barlow SE, Expert Committee. Expert committee recommendations regarding the prevention, assessment, and treatment of child and adolescent overweight and obesity: summary report. Pediatrics 2007;120 Suppl 4:S164–92.
crossref pmid pdf
34. Ogden CL, Kuczmarski RJ, Flegal KM, Mei Z, Guo S, Wei R, et al. Centers for Disease Control and Prevention 2000 growth charts for the United States: improvements to the 1977 National Center for Health Statistics version. Pediatrics 2002;109:45–60.
crossref pmid pdf
35. Kuczmarski RJ, Ogden CL, Guo SS, Grummer-Strawn LM, Flegal KM, Mei Z, et al. 2000 CDC Growth Charts for the United States: methods and development. Vital Health Stat 11 2002;(246):1–190.

36. Gulati AK, Kaplan DW, Daniels SR. Clinical tracking of severely obese children: a new growth chart. Pediatrics 2012;130:1136–40.
crossref pmid pmc pdf


ABOUT
ARTICLE CATEGORY

Browse all articles >

BROWSE ARTICLES
AUTHOR INFORMATION
Editorial Office
501-107, 30 Seocho-daero 74-gil, Seocho-gu, Seoul 06622, Republic of Korea
Tel: +82-2-3471-4268    Fax: +82-2-3471-4269    E-mail: editor@e-apem.org                

Copyright © 2024 by Korean Society of Pediatric Endocrinology.

Developed in M2PI

Close layer
prev next