Serum uric acid in Korean children and adolescents: reference percentiles and association with metabolic syndrome
Article information

Abstract
Purpose
To establish age/sex-specific reference intervals for serum uric acid and to examine the associations between serum uric acid level and metabolic syndrome (MetS) and its components in Korean children and adolescents.
Methods
We analyzed data for 1,349 subjects aged 10 to 19 years from the Korea National Health and Nutrition Examination Survey 2016–2017.
Results
The mean uric acid levels were 5.9±1.3 mg/dL (interquartile range, 5.0–6.8 mg/dL) in males and 4.6±0.9 mg/dL (interquartile range, 3.9–5.2 mg/dL) in females. The mean uric acid level increased significantly from 10–13 years of age in males, but not in females. The overall prevalence of MetS was 5.9% (7.3% in males and 4.3% in females; P=0.022). The prevalences of MetS in the lowest, second, third, and highest quartiles of uric acid level were 4.4%, 3.3%, 6.1%, and 15.2%, respectively, in males (P for trend <0.001) and 1.9%, 0.0%, 4.1%, and 10.9%, respectively, in females (P for trend <0.001). Compared with the lowest quartile of uric acid level, the odds ratio (with 95% confidence interval) for MetS in the highest quartile was 2.897 (1.140–7.361) in males and 5.173 (1.459–18.342) in females. Subjects in the highest quartile exhibited increased risk for abdominal obesity and low high-density lipoprotein cholesterol in both sexes.
Conclusions
Serum uric acid level is positively associated with MetS and its components abdominal obesity and low high-density lipoprotein cholesterol.
Introduction
Metabolic syndrome (MetS) is a combination of abdominal obesity, increased blood pressure, glucose intolerance, and dyslipidemia [1]. MetS is associated with global epidemics of type 2 diabetes mellitus (T2DM) and cardiovascular disease (CVD). The prevalence of MetS is estimated to be 4.2% to 6.4% among American children and 5.4% to 5.8% in Korean children and adolescents, according to the modified criteria of the National Cholesterol Education Program, Adult Treatment Panel III (NCEP-ATP III) [2,3]. In adults, the prevalence of MetS is estimated to be 17.8% to 25.0%, including Korea, and increases in frequency with age [4,5]. Moreover, MetS in childhood predicts adult MetS and T2DM 25 to 30 years later [6]. Furthermore, the risk for CVD was increased approximately 3-fold in subjects with MetS, and the hazard ratio for adults with MetS was 1.37 for mortality from CVD after adjustment for other confounders [7,8]. Thus, it is crucial to identify risk factors of MetS promptly and intervene in its progression to CVD and mortality in later life.
Uric acid (UA) is a heterocyclic compound with the formula C5H4N4O3 [9]. UA is a product of the metabolic breakdown of purine nucleotides and is endogenously formed by the liver and mainly excreted by the kidneys [10]. Although it is not confirmed whether UA causes or is a consequence of MetS, numerous studies in adults have shown strong associations between serum UA level and MetS or its components [10,11]. Ford et al. showed strong associations between serum UA level and MetS in children and adolescents in the US [12]. The odds ratio (OR) for MetS was 14.79 in subjects in the top quartile of UA level compared with the lowest quartile after adjustment for age, sex, and other confounders. Recently, a Taiwanese study predicted that a high level of UA (≥7.3 for males and ≥6.2 mg/dL for females) increases the chances for development of hypertension in both sexes and MetS in male adolescents after 10 years of follow-up [13]. Furthermore, Bhole et al. [14] showed that young adults with higher UA are at higher risk of developing T2DM in the future, independent of other known risk factors.
In pediatric fields, establishing early risk factors is important in the planning and prevention of T2DM and CVD in later life. In the present study, we aimed (1) to establish age- and sexspecific reference intervals for serum UA in a large, nationally representative cohort of Korean children and adolescents and (2) to examine associations between serum UA levels and the prevalence of MetS and its components in Korean children and adolescents.
Materials and methods
1. Subjects
The study was performed using data from the Korea National Health and Nutrition Examination Survey (KNHANES) during the period from 2016–2017. The KNHANES is a nationwide, cross-sectional, and representative survey that is conducted regularly by the Division of Chronic Disease Surveillance, Korea Centers for Disease Control and Prevention [15]. The survey, which is composed of a health examination, health questionnaire, and nutritional assessment, uses a stratified, multistage probability sampling design for the selection of household units. Details of the KNHANES have been described previously [16]. Written informed consent was obtained from all participants or parents of the participants before the commencement of the survey. Additionally, the KNHANES was conducted following ethical approval by the Institutional Review Board of the Korea Centers for Disease Control and Prevention. Thus, this study was exempted by the Institutional Review Board of Korea Cancer Center Hospital from needing to obtain participant consent.
In KNHANES 2016–2017, the data of 1,649 children and adolescents, aged 10–19 years, were available. We limited our analyses to the subjects who had serum UA data and complete information on MetS components (n=1,400). Among them, 40 subjects who had fasted for fewer than 8 hours were excluded. A total of 11 subjects who had chronic diseases like congenital heart disease and rheumatoid arthritis were also excluded. Thus, 1,349 subjects (703 males, 646 females) were included in the final analysis. The database is available to the public at the KNHANES website (http://knhanes.cdc.go.kr) [15].
2. Measurements
Anthropometric assessments were conducted using standard methods by a trained staff. Briefly, the height was measured to the nearest 0.1 cm using Seca 225 (Seca, Hamburg, Germany), and body weight was measured to the nearest 0.1 kg using GL6000-20 (G-tech, Seoul, Korea). The body mass index (BMI) was determined as the weight/square of height (kg/m2). The waist circumference (WC) was measured to the nearest 0.1 cm along the midline between the inferior margin of the last rib and the iliac crest. The systolic blood pressure (SBP, mmHg) and diastolic blood pressure (DBP, mmHg) were measured 3 times from the right upper arm using a calibrated sphygmomanometer (Baumanometer Wall Unit 33 [0850], Baum, NY, USA) and an appropriately sized cuff. The measurements were taken at 30-second intervals. Subsequently, the mean of the last 2 values was used for the analysis.
Blood samples were collected after the participants had fasted for 8 hours, and these were immediately processed, refrigerated, and transported to a central laboratory (NeoDin Medical Institute, Seoul, Korea) for analysis within 24 hours. Biochemistry tests, including analyses of the levels of glucose, triglycerides (TG), total cholesterol, and high-density lipoprotein cholesterol (HDL-C), were performed enzymatically using a Hitachi 7600 automatic analyzer (Hitachi, Tokyo, Japan). Lowdensity lipoprotein cholesterol (LDL-C) was determined with Friedewald's equation [17]. Serum UA level was measured using the calorimetry (uricase) method with a Hitachi Automatic Analyzer 7600–210 (Hitachi Medical Corp., Tokyo, Japan). High-sensitivity C-reactive protein (CRP) level was measured by immunoturbidimetry using Cobas (Roche, Mannheim, Germany).
3. Definition
MetS and its components were defined according to the modified NCEP-ATP III criteria in this study [18]. The diagnosis of MetS requires at least 3 of the following 5 criteria: abdominal obesity (WC≥90th percentile by age and sex, according to 2007 Korean growth charts) [19], hypertriglyceridemia (TG≥110 mg/dL), low HDL-C (HDL-C≤40 mg/dL), high blood pressure (SBP or DBP≥90th percentile by age, sex, and height, according to 2007 Korean growth charts) [19], and hyperglycemia (fasting glucose level ≥110 mg/dL).
4. Statistical analyses
First, serum UA level was plotted according to the age and sex. As serum UA levels showed differences in the distributions between the male and female populations, the analysis was performed separately according to sex. Subsequently, the correlations between UA level and each variable, including age, WC, BMI, SBP, DBP, fasting plasma glucose (FPG), log TG, HDL-C, LDL-C, and CRP level, were evaluated in total and separately according to sex. Second, we analyzed reference percentiles and quartiles for serum UA in Korean children and adolescents, with UA1 representing the lowest and UA4 representing the highest serum UA level quartiles. Normally, distributed variables are presented as means±standard deviations (SDs), whereas categorical variables are presented as percentages (%). The differences between the 2 groups were analyzed with a t-test. The differences in the categorical variables and normally distributed variables were analyzed using chisquare tests and analysis of variance according to UA quartile.
The prevalences of MetS and its components were calculated for each quartile of serum UA levels. To examine the association between MetS and serum UA level, we conducted multivariate logistic regression analyses adjusting for age and concentrations of CRP (model 1). In addition, we further conducted several logistic regressions to examine the associations between each component of MetS and serum UA level after adjusting for age, CRP, and other components of MetS as dichotomized variables (model 2). The ORs and 95% confidence intervals for MetS and MetS components were determined according to UA quartile, with the lowest quartile serving as a reference. All significances were analyzed using a 2-tailed method, and a P-value <0.05 was considered as statistically significant. All analyses were conducted using IBM SPSS Statistics ver. 22.0 (IBM Co., Armonk, NY, USA).
Results
1. Clinical characteristics of study subjects
The anthropometric and laboratory characteristics of the study subjects are summarized in Table 1. The mean age of the subjects was 14.4±2.8 years. It was observed that the male subjects showed significantly higher BMI, WC, SBP, FPG, CRP, and serum UA levels and lower total cholesterol, HDL-C, and LDL-C levels than the female subjects.
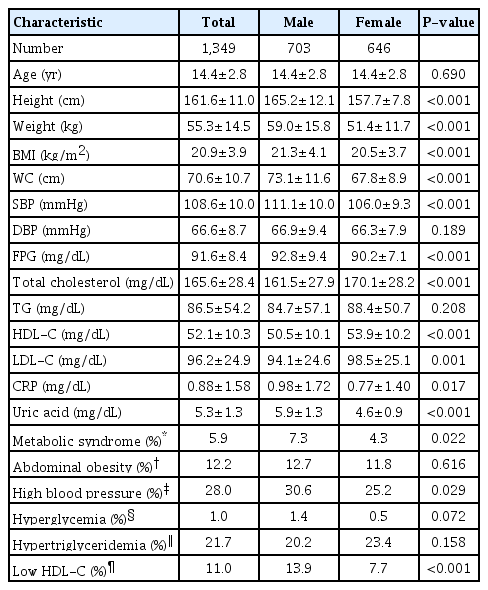
Characteristics of the study subjects aged 10–19 years
Among the 1,349 subjects, the overall prevalence of MetS was 5.9% (7.3% in male and 4.3% in female subjects; P=0.022). The contributing factors of MetS, abdominal obesity, hyperglycemia, high blood pressure, hypertriglyceridemia, and low HDL-C, were observed in 12.2%, 1.0%, 28.0%, 21.7%, and 11.0% of the subjects, respectively. The male subjects had a higher prevalence of high blood pressure and low HDL-C than the female subjects.
2. Correlation between serum UA levels and the metabolic parameters
WC, BMI, SBP, DBP, HDL-C, and log TG correlated significantly with serum UA levels in both sexes (Supplementary Table 1). However, there were differences due to sex when the analysis was conducted separately. In males, UA levels showed a negative correlation with FPG (-0.127, P=0.001) and a positive correlation with age (0.378, P<0.001). In females, UA levels showed no correlation with FPG or age. Meanwhile, CRP level was positively correlated with serum UA levels in females (0.186, P<0.001), but not in males.
3. Age- and sex-stratified means and percentile values for serum UA
The distribution of UA levels of the study subjects and UA levels according to sex and age are shown in Fig. 1. The overall mean (±SD) UA level was 5.3±1.3 mg/dL (5.9±1.3 mg/dL in males vs. 4.6±0.9 mg/dL in females, P<0.001), with an interquartile range of 5.0–6.8 mg/dL in males and 3.9–5.2 mg/dL in females. Age- and sex-stratified means, quartiles, and percentile values for UA levels of the Korean youth are presented in Table 2. UA level increased significantly from age 10–13 years in males, but not in females. UA levels were significantly higher in males aged 12–13 than in males aged 10–11. Males aged 14–19 also had significantly higher UA levels than males aged 12–13 (P<0.001). There was no difference in UA levels among age groups in the female subjects.
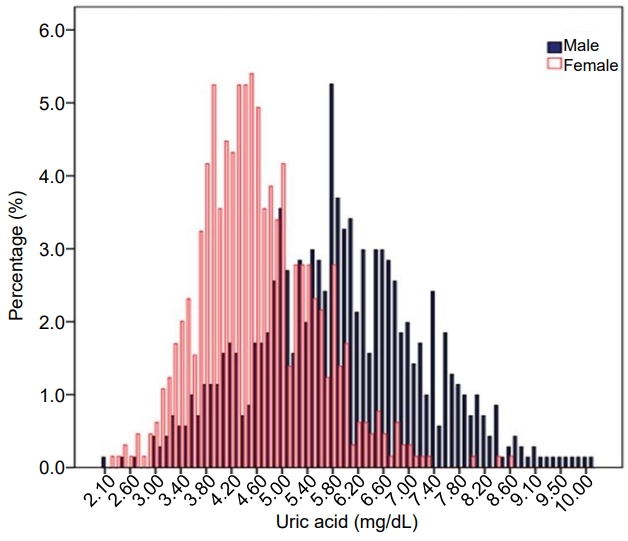
Distribution of serum uric acid levels in Korean children and adolescents aged 10–19 years, Korea National Health and Nutrition Examination Survey 2016–2017.

Serum uric acid levels (mg/dL) of Korean children and adolescents aged 10–19 years, KNHANES 2016–2017
4. Adjusted ORs of MetS and its components according to UA quartiles
Serum UA was higher in subjects with MetS than in those without MetS in both sexes (6.7±1.5 mg/dL vs. 5.9±1.3 mg/dL, P<0.001 in males, and 5.6±1.3 mg/dL vs. 4.5±0.9 mg/dL, P<0.001 in females). Additionally, CRP was higher in subjects with MetS (1.71±2.14 mg/dL vs. 0.92±1.67 mg/dL, P=0.012 in males, and 1.97±2.01 vs. 0.71±1.34 mg/dL, P<0.001 in females).
The prevalence of MetS according to UA quartiles is depicted in Fig. 2. The prevalences of MetS in the lowest, second, third, and highest quartiles were 4.4%, 3.3%, 6.1%, and 15.2%, respectively, among the male subjects (P for trend <0.001) and 1.9%, 0.0%, 4.1%, and 10.9%, respectively, for the female subjects (P for trend <0.001). In both sexes, when compared with the UA1 group, the UA4 group had a higher prevalence of MetS. The adjusted ORs of MetS and MetS components according to the UA quartiles after controlling for the previously mentioned confounders are presented in Table 3. Upon comparison with the UA1 group, the OR for having MetS in the UA4 group was 2.897 (1.140–7.361) in the male subjects and 5.173 (1.459– 18.342) in the female subjects. Additionally, significant positive linear associations were observed between UA quartiles and abdominal obesity and low HDL-C in both sexes. A positive association with hypertriglyceridemia was observed only in females. UA quartiles were not associated with high blood pressure and hyperglycemia in either sex.
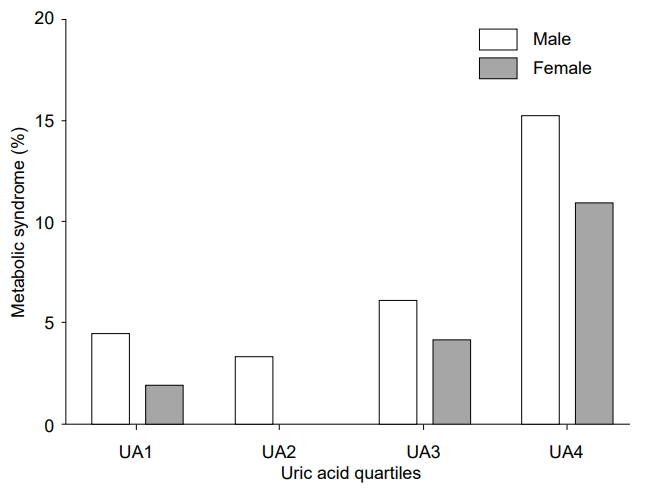
Prevalence (95% confidence intervals) of metabolic syndrome according to uric acid quartiles in Korean children and adolescents aged 10–19 years, Korea National Health and Nutrition Examination Survey 2016–2017. UA1, the lowest quartile of serum uric acid level; UA2, the second quartile of serum uric acid level; UA3, the third quartile of serum uric acid level; UA4, the highest quartile of serum uric acid level.
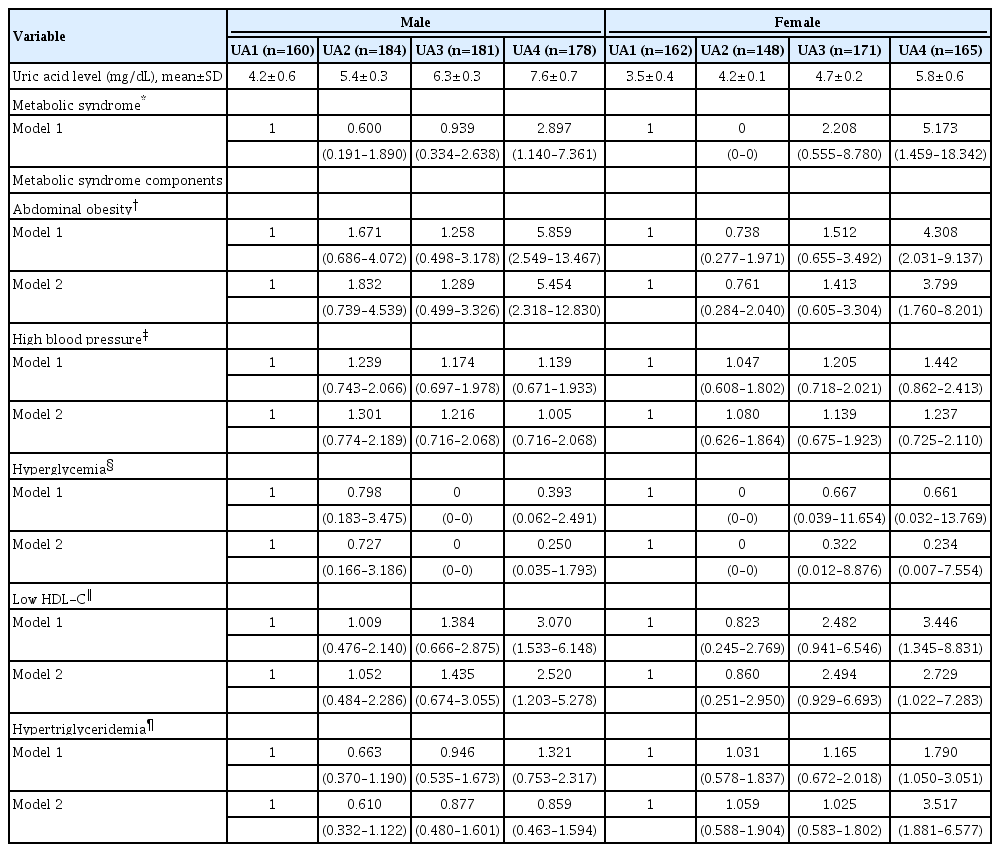
Adjusted odds ratio (95% CI) of metabolic syndrome and its components according to the uric acid quartiles of subjects aged 10–19 years, KNHANES 2016–2017
Discussion
In the present study, we created reference ranges of serum UA values for Korean children and adolescents aged 10–19 years using a nationally representative sample. Additionally, we found that subjects in both sexes in the highest quartile of UA exhibited increased risks for MetS and its components compared to those in the lowest quartile, after adjusting for confounders.
In this study, age- and sex-stratified reference intervals were formed for serum UA in Korean children and adolescents. The reference UA values in Korean adolescents revealed distinctive characteristics. For both sexes, the mean UA levels and agespecific distributions in our study sample were similar to those in non-Hispanic whites. According to the NHANES 2005–2008, the mean UA levels and the 95th percentile were 5.80 and 8.10 mg/dL, respectively, in white male adolescents and 4.50 and 6.10 mg/dL, respectively, in white female adolescents [20]. In a previously conducted Chinese study, the median UA levels were 5.8 and 4.3 mg/dL in male and female adolescents, respectively [21]. In our study, differences in UA levels based on sex were observed among the subjects. The UA levels were significantly higher in males than in females. The UA levels were significantly higher in males aged ≥12 years in this study, consistent with the results reported in previous studies [22,23].
In this study, we substantiated previous studies [12,24] that showed a close association between increased levels of UA and MetS and some components of MetS in Korean children and adolescents. Our study population of Korean children and adolescents revealed distinctive characteristics in the associations between hyperuricemia and MetS components when compared to other populations. For instance, in a nationally representative sample of US adolescents, Ford et al. reported that the highest quartile of UA (>5.7 mg/dL irrespective of sex) was associated with MetS [12]. They also found that subjects with the highest quartile of serum UA had a higher OR for abdominal obesity, hypertriglyceridemia, hyperglycemia, and hypertension, but not low HDL. However, in our study, the subjects in the highest quartile showed a significantly increased OR only for abdominal obesity and low HDL-C. Thus, the relationship between hyperuricemia and components of MetS such as hyperglycemia and low HDL-C might vary depending upon the ethnicity. In Korean adults, serum UA level was negatively correlated with the HDL-C level [25]. Furthermore, a Taiwanese longitudinal study showed that high serum UA was associated with future increases in WC, SBP, TG, and HDL-C, but not FPG [26]. The study also explained that the FPG levels were maintained in a relatively normal range in youth, as the β-cell function was still preserved. Increasing insulin secretion to compensate for insulin resistance (IR) does not become impaired until middle age [27].
The pathophysiology of the association between serum UA and MetS is not fully understood. One possible explanation is that hyperuricemia is the consequence of IR. As with abdominal obesity, IR is a key component of MetS [28]. IR promotes the synthesis of UA and inhibits its excretion. The renal clearance of UA is inversely related to the degree of IR, and hyperinsulinemia is known to reduce the renal excretion of UA [29]. In subjects with MetS, increased production along with reduced renal excretion of UA may explain the increased frequency of hyperuricemia. The other suggested pathophysiology is that hyperuricemia is a part of MetS induced by excessive fructose intake. Lim et al. [30] suggested the role of fructose in the pathogenesis of MetS. Unlike glucose, the hepatic metabolism of fructose causes obesity, TG formation, hyperglycemia, IR, and increased BP. Fructose is phosphorylated by fructokinase, which depletes the hepatocyte adenosine monophosphate and results in excessive UA generation. The consumption of sugar-sweetened beverages (primarily fructose) positively correlates with UA and blood pressure levels and BMI in children and adolescents [30,31]. Allopurinol, a UA inhibitor, can reduce blood pressure in adolescents. Also, a low fructose diet resulted in weight loss in obese, prehypertensive adults independent of energy intake [32,33].
The major strength of the present study is the use of large nationally representative study population. However, this study has some limitations. First, the cross-sectional nature of the study prohibits conclusions regarding the existence of a causal relationship. However, it was well known that an elevated UA level is a predictive factor for developing MetS and can aid in the prediction of future increases in WC, SBP, TG, and HDL-C in adolescents [26]. Second, IR is an important aspect of MetS. However, we did not have any data on plasma insulin concentration. Thus, measurements of IR were not available, and this weakens our results. Finally, we did not examine the relationship between serum UA level and dietary variables, especially fructose intake. In future analyses, it is essential to determine whether a particular dietary intake, especially fructose, influences serum UA levels.
In conclusion, we developed reference ranges of serum UA percentiles and quartiles for Korean children and adolescents. The present study has confirmed the association between the highest quartiles of serum UA and increased risks for MetS and its components in Korean children and adolescents. These results also confirm that hyperuricemia might be valuable in predicting MetS in this population. In the future, large-scale clinical trials are required to determine whether lowering UA levels can prevent and treat abdominal obesity, low HDL-C, and MetS.
Notes
Ethical statement
The Research Ethics Committee of the Korea Centers for Disease Control approved the study protocol (No. 2019-07-005), and all participants or their parents signed a written informed consent form.
Conflicts of interest
No potential conflict of interest relevant to this article was reported.
Acknowledgements
This study was supported by a grant of the Korea Institute of Radiological and Medical Sciences (KIRAMS), funded by the Ministry of Science and ICT (MSIT), Republic of Korea (No.50541-2019).
Supplementary Materials
Supplementar y Table 1 can be found via https://doi.org/10.6065/apem.1938156.078