Risk assessment of metabolic syndrome in adolescents using the triglyceride/high-density lipoprotein cholesterol ratio and the total cholesterol/high-density lipoprotein cholesterol ratio
Article information

Abstract
Purpose
This study was conducted to investigate the distributions of the triglyceride (TG) to high-density lipoprotein-cholesterol (HDL-C) ratio and total cholesterol (TC) to HDL-C ratio, and to explore their usefulness as markers of metabolic syndrome (MetS) in Korean adolescents.
Methods
We obtained data for 2,721 adolescents (1,436 boys and 1,285 girls) aged 10–18 years who participated in the Korean National Health and Nutrition Examination Surveys from 2008 to 2010. International Diabetes Federation criteria were used to define MetS.
Results
There were no significant gender-related differences in TG/HDL-C or TC/HDL-C ratios. These lipid ratios showed significant associations with homeostatic model assessment for insulin resistance (HOMA-IR) and waist circumference. Areas under the receiver operating characteristic curve to identify MetS were 0.947 for TG/HDL-C and 0.924 for TC/HDL-C, which were higher than that of HOMA-IR (0.822). Optimal cutoff values (sensitivity, specificity) of TG/HDL-C and TC/HDL-C ratios for MetS prediction were 3.3 (85.7%, 89.9%), and 3.8 (92.9%, 82.8%), respectively. Odds ratio (OR; 95% confidence intervals [CIs]) for MetS in adolescents with TC/HDL-C ratio above the cutoff value was 14.8 (2.8–77.4), while that for TG/HDL-C ratio about the cutoff value was 30.6 (6.0–157.6). In adolescents who had both lipid ratios above the cutoff values, the OR (95% CI) for MetS was 36.2 (7.2–186.2).
Conclusion
TG/HDL-C and TC/HDL-C ratios are useful markers of metabolic syndrome with high predictive value in Korean adolescents.
Introduction
Urinary calcium excretion is used to evaluate various clinical conditions, such as idiopathic Metabolic syndrome (MetS) is characterized by cardiovascular and metabolic derangements including abdominal obesity, impaired fasting glucose, hypertension, and dyslipidemia [1]. It is considered to indicate a state of chronic inflammation resulting from visceral fat accumulation and development of insulin resistance [2]. MetS is a well-known risk factor for cardiovascular disease and type 2 diabetes mellitus in both children and adults. Because childhood MetS often leads to adulthood MetS [3], early detection and management of MetS in the pediatric population are critical to prevent the development of cardiovascular disease in later life.
Despite the clinical importance of MetS, determining individuals who are predisposed to MetS is difficult due to a lack of consensus regarding the cutoff value for MetS in children and adolescents. Cutoff value for triglycerides (TG) in children and adolescents proposed by the International Diabetes Federation (IDF) criteria [4] is 150 mg/dL, while that suggested by the modified National Cholesterol Education Program, Adult Treatment Panel III [5] is 110 mg/dL. This considerable gap in cutoff could be due in part to changes in lipid profiles according to age and sex during adolescence, which make it hard to determine a meaningful cutoff value for dyslipidemia in terms of cardiovascular disease risk.
In adults, lipid ratios, such as the TG to high-density lipoprotein cholesterol (HDL-C) ratio and total cholesterol (TC) to HDL-C ratio are widely used for cardiovascular disease risk assessment. These ratios indicate the balance between all atherogenic cholesterols (very low-density lipoproteincholesterol [VLDL-C], intermediate-density lipoprotein cholesterol, low-density lipoprotein-cholesterol [LDL-C]) and antiatherogenic cholesterol (HDL-C), which is a major determinant of cardiovascular risk. Previous large-scale prospective studies had shown that the TC/HDL-C ratio can be a reliable predictor of coronary heart disease and death [6-8]. Meanwhile, insulin resistance is accompanied by excessive production of VLDL-C from the liver and chemical transformation of HDL particles resulting in more rapid excretion from the kidneys, resulting in changes in lipid profiles such as elevation of TG and a decrease in HDL-C [9]. In this context, TG/HDL-C ratio has been shown to be directly associated with insulin resistance and cardiovascular events in adults [10,11], and has also been demonstrated to be related to insulin resistance and carotid artery intima-media thickness in both adults and children [12,13].
A recent study demonstrated a strong relationship between TC/HDL-C and TG/HDL-C ratios and MetS in the adult population in Korea [14], but optimal cutoff values and predictive values of these lipid ratios for MetS have not been presented. We hypothesized that TG/HDL-C and TC/HDL-C ratios may be appropriate markers of MetS in adolescents, and that their cutoff values could be useful for early detection of MetS. We designed this study to examine the age and sex-related distribution of TG/HDL-C and TC/HDL-C ratios and to determine their optimal cutoff values as surrogate markers for MetS in Korean adolescents.
Materials and methods
1. Study population
We utilized data collected from the Korean National Health and Nutrition Examination Surveys (KNHANES) between 2008 and 2010. This cross-sectional nationwide survey includes measures of anthropometry and blood pressure, and biochemical profiles including fasting insulin, glucose, and lipids. We limited the analyses to adolescents aged 10–18 years. Participants with incomplete data for laboratory tests and those who had fasted less than 8 hours before blood sampling were excluded. Those who had diabetes mellitus, and those taking any medications that could possibly affect serum lipid concentrations were excluded as well. Finally, a total of 2,721 adolescents (1,436 boys and 1,285 girls) were included in the final analysis.
2. Data collection
Participants' heights and body weights were measured to the nearest 0.1 cm and 0.1 kg, respectively. Body mass index (BMI) was calculated by dividing weight (kg) by height squared (m2). Waist circumference measurement was performed at the narrowest area between the rib cage and the iliac crest. Blood pressure was measured using a standard mercury sphygmomanometer with the participant seated. After an overnight fast, blood samples were obtained to measure glucose, insulin, and lipid profiles. Serum concentrations of glucose and lipids (TG, TC, HDL-C, and LDL-C) were analyzed by an enzymatic colorimetric method (Pureauto S GLU; Pureauto S TG-N; Pureauto SCHO-N; CHOLESTEST N HDL; CHOLESTEST LDL, DAIICHI, Japan) using a Hitachi Automatic Analyzer 7600 (Hitachi, Tokyo, Japan), and fasting insulin was analyzed by an immunoradiometric assay kit (INS-IRMA, BioSourse, Belgium) using a gamma counter (1470 Wizard, Perkin-Elmer, Turku, Finland). HOMA-IR was calculated to approximate insulin resistance in subjects according to the following formula: fasting glucose (mg/dL) × fasting insulin (mU/mL)/405 [15].
3. Criteria for obesity, central obesity, and MetS
In this study, we used the adolescent IDF criteria to define MetS [4]. According to the IDF criteria, central obesity (a waist circumference ≥ 90th percentile for sex and age) is a mandatory factor, and two or more of the following components are also required for diagnosis: fasting glucose ≥100 mg/dL, fasting TG ≥150 mg/dL, hypertension (systolic≥130 mmHg/diastolic≥85 mmHg), and low HDL-C (<40 mg/dL for boys and girls aged <16 years and <50 mg/dL for girls aged 16–18 years). Obesity status was defined according to the BMI percentile for sex and age: underweight (<5th percentile), normal (BMI 5th to 84th percentile), overweight (BMI 85th to 94th percentile), and obese (BMI≥95th percentile). Sex and age-specific reference values for BMI/waist circumference percentile were based on Korean national reference standards [16].
4. Statistical analysis
Statistical analysis was conducted using IBM SPSS Statistics ver. 23.0 (IBM Co., Armonk, NY, USA). In all analyses, sampling weights were applied to reflect the multistage complex sampling survey design. Complex samples descriptive procedure was used for continuous variables, and the complex samples crosstabs were used for categorical or ordinal variables. Geometric means (95% confidence intervals [CIs])and percentile values for serum concentrations of lipid profiles, TG/HDL-C ratio, and TC/HDL-C ratio were calculated. The complex samples general linear model was used to compare serum concentrations of lipid profiles, TG/HDL-C ratio, and TC/HDL-C ratio according to age group (10–12, 13–15, and 16–18 years). Multiple linear regression analysis was performed to determine the associations between serum lipid profiles and lipid ratios with other cardiometabolic indicators after controlling for sex, age, and height. To determine the clinical utility and optimal cutoff values for lipid ratios in predicting MetS, receiver operating characteristic (ROC) curve analysis was used. Optimal cutoff value for a particular variable was defined as the point at which the Youden index (sensitivity+specificity–1) was maximum. Adjusted odds ratios (ORs; 95% CIs) for MetS were calculated by multivariate logistic regression analysis according to the presence/absence of high lipid ratios after controlling for age, sex, and BMI. Because of the skewed distributions of TG, TG/HDL-C ratio, and HOMA-IR, these parameters were logarithmically transformed. Two-tailed P-values of <0.05 were considered statistically significant for all analyses.
Results
1. General characteristics and serum lipid parameters of the study population
General characteristics of the study population are described in Table 1. Geometric mean concentrations of TC, HDL-C, LDL-C, TG, and non-HDL-C were 156.6 mg/dL, 48.8 mg/dL, 89.7 mg/dL, 76.1, and 106.2 mg/dL, respectively. While TC, HDL-C, non-HDL-C, and LDL-C levels were significantly higher in girls than boys, TG levels were not significantly different between sexes. Geometric mean values of the TG/HDL-C ratio, TC/HDL-C ratio, and HOMA-IR were 1.6, 3.2, and 3.0 respectively, with no significant sex-related differences. Prevalence of MetS was not significantly different between boys and girls (1.2% in boys, 1.7% in girls).

Subject general characteristics
Table 2 shows mean and percentile values of serum lipid parameters and lipid ratios by sex and age. In boys, geometric mean values of TC, HDL-C, LDL-C, and non-HDL-C decreased with age, while that of TG increased with age. In girls, no agerelated differences were observed in the average values of TC, HDL-C, or non-HDL-C. LDL-cholesterol level increased in girls with age, whereas triglyceride level decreased with age. No significant differences in TC/HDL-C ratio according to age were observed in either sex. TG/HDL-C ratio increased significantly with age in boys, while it decreased with age in girls. Correlation coefficients among cardiometabolic indicators and lipid parameters are presented in Supplementary Table 1. After adjusting for confounding variables including sex, age, height, TC/HDL-C ratio, TG/HDL-C ratio, and non-HDL-C showed significant associations with waist circumference, fasting glucose, insulin, HOMA-IR, and systolic/diastolic blood pressures (all P<0.01).

Distributions of lipid profiles by age group
2. ROCs analyses
Fig. 1 and Table 3 show the results of ROC curve analysis of lipid parameters and HOMA-IR for MetS. Values of the area under the curve (AUC) were greater for the TG/HDL-C ratio (AUC=0.932) and TC/HDL-C ratio (AUC=0.923) than for individual lipid profiles including TG (AUC=0.909) and HOMA-IR. Of note, in boys, unlike in girls, the AUC values of TG/HDL-C and TG were higher than that of the TC/HDL-C ratio. In contrast, the AUC value of TC/HDL-C was higher than those of TG and TG/HDL-C in girls. The optimal cutoff values of TG/HLD-c ratio and TC/HDL-c ratio for validating individuals with MetS were 3.3 and 3.8 in both boys and girls. Sensitivity (specificity) of the TG/HDL-C ratio and TC/HDL-C ratio were 90.0% (89.1%) and 90.0% (81.4%) in boys, respectively, and 81.8% (92.4%) and 95.5% (84.0%) in girls, respectively.
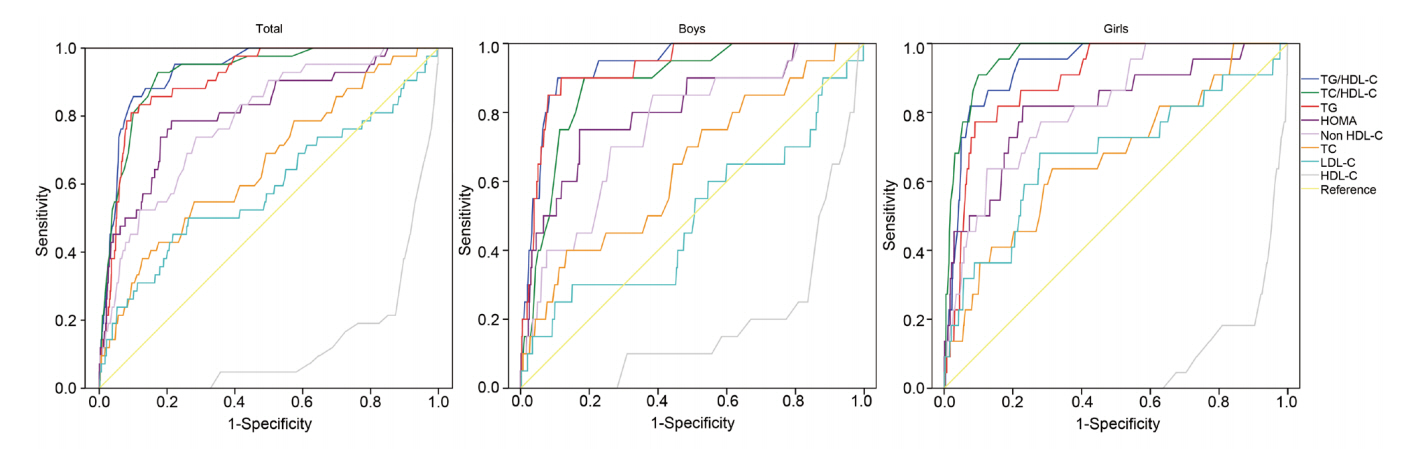
Receive-operating characteristic (ROC) curves of lipid parameters and homeostatic model assessment for insulin resistance (HOMA-IR) for metabolic syndrome. The area under the curve (AUC) values of the TG/HDL-C ratio and TC/HDL-C ratio were higher than those of the other lipid profiles. The AUC value of the TG/HDL-C ratio was higher than that of the TC/HDL-C ratio in boys. In contrast, the AUC value of the TC/HDL-C ratio was higher than that of the TG/HDL-C ratio in girls. TC/HDL-C, total cholesterol to high density lipoprotein cholesterol; TG/HDL-C, triglyceride to high density lipoprotein cholesterol.

AUCROC and cutoff values of HOMA-IR and lipid parameters for prediction of metabolic syndrome
3. Prevalence and odds ratios of MetS according to lipid ratios
The prevalence of MetS in adolescents with central obesity according to lipid ratios is shown in Fig. 2. The prevalence of MetS in centrally obese adolescents with lipid ratios below the cutoff values was only 4.4% (3.4% in boys and 5% in girls). In those with lipid ratios above the cutoff values, MetS prevalence increased to 30.7% (26.3% in boys and 36% in girls). In those with both lipid ratios above the respective cutoffs, the prevalence of MetS reached up to 52.4% (78% in boys and 61.4% in girls). Adjusted ORs (95% CI) for MetS in individuals with a high TC/HDL-C ratio (≥3.8) and/or TG/HDL-C ratio (≥3.3) are shown in Fig. 3. The OR (95% CI) for MetS in individuals with a TC/HDL-C ratio≥3.8 was 14.8 (2.8–77.4) and those with a TG/HDL-C ratio≥3.3 was 30.6 (6.0–157.6). When TC/HDL-C and TG/HDL-C were both above the cutoff values, the OR (95 CI) for MetS increased to 36.2 (7.2–186.2).
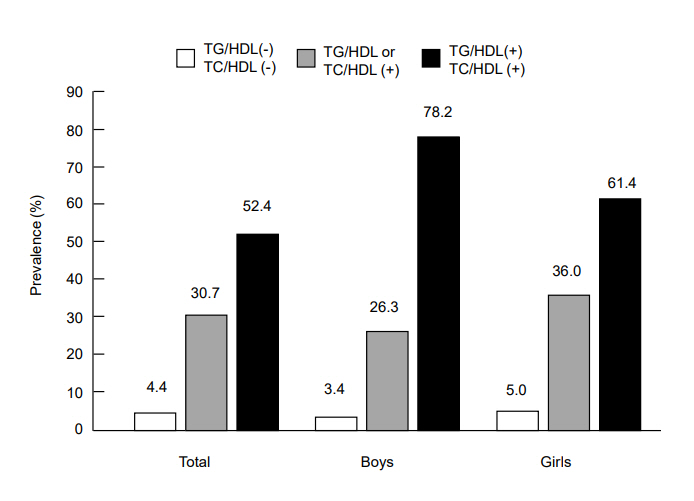
Prevalence of metabolic syndrome in Korean adolescents with central obesity (n=234; 113 boys,121 girls) in accordance with TG/HDL-C ratio and TC/HDL-C ratio was as follows: 4.4% in those with both lipid ratios below the cutoffs, 30.7% in those with one of the lipid ratios above the respective cutoff, 52.4% for those with both lipid ratios above the cutoffs. Cutoffs of TG/HDL-C and TC/HDL-C were 3.3 and 3.8, respectively. TC/HDL-C, total cholesterol to high density lipoprotein cholesterol; TG/HDL-C, triglyceride to high density lipoprotein cholesterol.
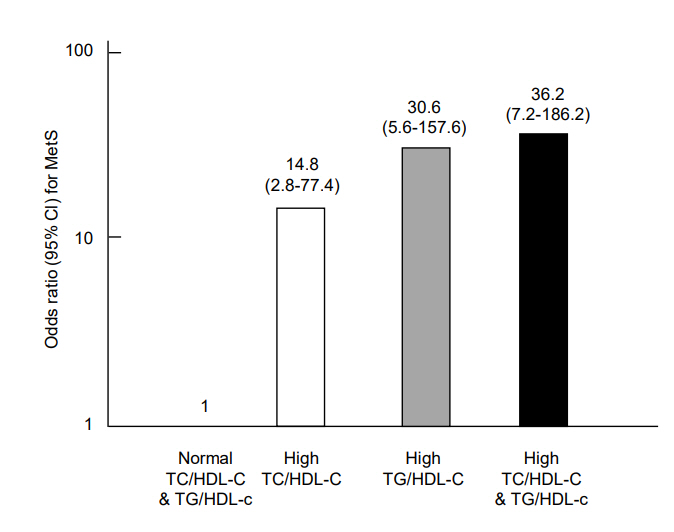
Adjusted odds ratios for metabolic syndrome (MetS) in adolescents whose lipid ratio values were above the cutoffs (TC/HDL-C ratio≥3.8, TG/HDL-C ratio≥3.3) relative to the adolescents whose lipid ratios were within normal ranges (adjusted for sex, age, and body mass index). The odds ratio (95% confidence interval) for MetS in adolescents with a high TC/HDL-C ratio, high TG/HDL-C ratio, and high TG/HDL-C & TC/HDL-C ratios were 14.8 (2.8–77.4), 30.6 (6.0–157.6), and 36.2 (7.2–186.2), respectively. TC/HDL-C, total cholesterol to high density lipoprotein cholesterol; TG/HDL-C, triglyceride to high density lipoprotein cholesterol.
Discussion
In this study, we demonstrated that both the TG/HDL-C ratio and TC/HDL-C ratio are highly associated with components of MetS and the HOMA-IR index. The optimal cutoff values of the TG/HDL-C ratio and TC/HDL-C ratio to identify Korean adolescents with MetS were 3.3 and 3.8, respectively. We also demonstrated that all of these lipid ratios were superior surrogate markers for adolescent MetS than single lipid measurements and HOMA-IR index. Furthermore, we demonstrated that the risk of MetS was significantly increased in adolescents with lipid ratios above the cut-off values after controlling for age, sex, and BMI.
Cholesterol is primarily transported in the circulation surrounded by VLDL, LDL, and HDL particles, while TG are transported by VLDL particles. Thus, serum TC and TG levels reflect the serum concentrations of lipoprotein particles transporting them [17]. LDL is well-known to be the major atherogenic lipoprotein, and small VLDL and intermediatedensity lipoprotein have also been identified to have atherogenic activity [18]. Meanwhile, HDL-C has antiatherogenic activity by promoting removal of lipid deposits from atherogenic vascular lesions and by having antioxidant and anti-inflammatory effects [19,20]. Taken together, TC/HDL-C ratio and TG/HDL-C ratio may reasonably reflect the balance of those atherogenic and antiatherogenic lipoproteins, which would explain why these ratios appear to be more useful indicators of cardiovascular risk than individual lipid profiles.
Several studies have shown a direct association between TG/HDL-C ratio and insulin resistance as determined by the HOMA-IR index or hyperinsulinemic-euglycemic clamp in both adults [21-23] and children [24,25]. Furthermore, TG/HDL-C ratio has been advocated as a practical and helpful predictor to identify individuals at risk of MetS [14,24,25]. Similar to those previous studies, we demonstrated that TG/HDL-C ratio was strongly correlated with waist circumference, blood pressure, fasting blood sugar, and HOMA-IR index. The cutoff value of TG/HDL-C ratio for increased risk of MetS in Korean adolescents was 3.3, which corresponds to the 89 percentile value of TG/HDL-C ratio in this population. Although it is difficult to directly compare our results with other studies due to differences in age and the criteria used to define MetS, the cutoff value for TG/HDL-C ratio in this study was higher than that (1.25) of Chinese children aged 6–16 years [24] and that (2.2) of Italian children aged 5–18 years [25]. Furthermore, a previous study conducted among Italian children revealed increased ORs (9.87–57.74) for MetS in subjects with a high TG/HDL-C ratio [26]. Similar to that study, we demonstrated an increased OR (30.64) for MetS in adolescents with a TG/HDL-C ratio≥3.3, which was statistically significant even after controlling for age, sex, and BMI.
Most previous studies on the clinical usefulness of the TC/HDL-C ratio have been concerned with the severity of the coronary/cerebrovascular disease [7,8,27]. In contrast, the relationship between TC/HDL-C and components of MetS has rarely been studied. One study of a Korean population demonstrated that TC/HDL-C ratio and TG/HDL-C ratio showed a strong correlation with the risk of MetS [14]. Nevertheless, the predictive value or optimal cutoff values of TC/HDL-C ratio for MetS have not been fully investigated. In this study, we found that TC/HDL-C ratio was strongly correlated with all components of MetS and the HOMA-IR index. We also demonstrated that an optimal cutoff value of TC/HDL-C ratio for MetS is 3.8, which corresponds to the 80th percentile value of TC/HDL-C ratio in this population. Furthermore, we found that adolescents with a TC/HDL-C ratio≥3.8 showed a significantly increased OR (14.80) for MetS, and a further increase in OR (36.20) was found in those with both a high TC/HDL-C ratio and high TG/HDL-C ratio.
Lipid ratios, especially the TC/HDL-C ratio, have several advantages when used as predictors to identify MetS in Korean adolescents. First, we found no sex-related differences in TC/HDL-C ratio or TG/HDL-C ratio. Second, we observed no age-related changes in TC/HDL-C ratio in either sex, in contrast with the TG/HDL-C ratio. Another advantage of TC/HDL-C ratio as a convenient marker for MetS is that it does not require fasting, which is an important strength for children and adolescents who have difficulty fasting [28,29]. In addition, these lipid ratios showed a higher AUC value (sensitivity and specificity) in ROC curve analysis for MetS than HOMA-IR and individual lipid parameters including non-HDL-C. A previous study also demonstrated that U.S. adolescents with higher non-HDL-C levels (≥120–145 mg/dL) were more likely to have MetS [30]. In our study, non-HDL-C level showed fair sensitivity (73.8%) and specificity (71.4%) for detection of adolescent MetS; however, its discriminative power was inferior compared with lipid ratios and HOMA-IR. Moreover, we found a considerable difference in non-HDL-C cutoff values between boys and girls (110 mg/dL vs. 138 mg/dL). These results suggest that TC/HDL-C ratio and TG/HDL-C ratio could be more useful for screening for adolescent MetS than non-HDL-C.
This study had several limitations. First, because we used a cross-sectional design, we were not able to determine if these lipid ratios could predict MetS in adulthood. Second, the reason why the TG/HDL-C ratio had a high AUC value for detecting MetS may be that it contains two of the diagnostic criteria of MetS. Furthermore, TG concentration differs substantially with time after the last meal, therefore the TG/HDL-C ratio is less useful than the TC/HDL-C ratio, which is not influenced by meal time. Nonetheless, because the TG/HDL-C ratio showed a strong association with cardiometabolic indices including waist circumference, blood pressure, and HOMAIR index, we speculate that the TG/HDL-C ratio would be useful for identifying adolescents at high risk of MetS despite having TG and HDL-C values within normal ranges. Third, because we evaluated only Korean adolescents in this study, this result cannot be directly applied to adolescents of other races. Nonetheless, because this study evaluated a large, nationally representative samples of Korean adolescents, the results can be used as a practical reference for further studies and be applied in actual clinics. Furthermore, to the best of our knowledge, this study is the first to analyze and compare the usefulness and optimal cutoff values of TC/HDL-C ratio and TG/HDL-C ratio as predictors of adolescent MetS.
In conclusion, we found a strong relationship between lipid ratios (TG/HDL-C and TC/HDL-C ratio) and components of MetS, and determined optimal cutoff values of TG/HDL-C ratio and TC/HDL-C ratio to identify Korean adolescents with MetS. Korean adolescents with a high TG/HDL-C or TC/HDL-C ratio were at increased risk for MetS, and the risk for MetS was further increased when both of these lipid ratios were high. Thus, both of these lipid ratios could help health providers to identify adolescents who require therapeutic management and follow-up.
Notes
Ethical statement: Informed written consent was obtained from all participants and their parents. Since the KNHANES is a de-identified and publicly available dataset, this study was exempted from Institutional Review Board approval.
Conflict of interest: No potential conflict of interest relevant to this article was reported.
Supplementary material
Supplementary Table 1 can be found via https://doi.org/10.6065/apem.2019.24.1.41.