Is there a characteristic pattern of ambulatory blood pressure profile in type 1 diabetic children and adolescents?
Article information

Abstract
Purpose
To examine the characteristics of ambulatory blood pressure (ABP) including blood pressure variability (BPV) and its association with albuminuria in type 1 diabetic (T1D) children and to identify potential predictors of high-normal albuminuria and microalbuminuria.
Methods
ABP monitoring was performed in 201 T1D children and adolescents (mean age, 14.7±3.8 years) with T1D duration over 1 year. The level of albuminuria was assessed as the albumin/creatinine ratio (ACR) and patients were further classified as low-normal, high-normal or microalbuminuria.
Results
Fifteen T1D children (7.5%) were hypertensive using office blood pressure (BP) and 10 (5%) according to ABP. T1D subjects had elevated 24-hour systolic BP (SBP) and diastolic BP (DBP) (+0.2 and + 0.3 standard deviation score [SDS]) and nighttime SBP and DBP (+0.6 and +0.8 SDS) compared to reference values. Patients with microalbuminuria had significantly higher 24-hour, daytime and nighttime DBP compared to normoalbuminuric subjects. There was a high percentage of nondippers (74.1%). Nighttime diastolic BPV was significantly higher in subjects with high-normal compared to low-normal albuminuria (p=0.01). A weak correlation was found between ACR and daytime DBP SDS (r=0.29, p<0.001 and nighttime DBP SDS (r=0.21, p=0.003). Age and nighttime diastolic BPV were predictors of high-normal albuminuria while nighttime DBP was a strong predictor for microalbuminuria.
Conclusions
T1D children have impaired BP regulation although most of them do not fulfill the criteria for sustained hypertension. There is an association between diastolic ABP and diastolic BPV with rising levels of albuminuria pointing to a clear connection between BP and incipient diabetic nephropathy.
Highlights
· Children and adolescents with type 1 diabetes have elevated 24-hour and nighttime systolic and diastolic BP compared to general pediatric population
· Nighttime DBP and diastolic BPV are independent predictors for microalbuminuria and high normal albuminuria, respectively
Introduction
Cardiovascular disease remains the leading cause of morbidity and mortality in adults with type 1 diabetes mellitus (T1D) [1]. Blood pressure (BP) regulation represents an important modifiable risk factor for the development of cardiovascular disease and consequently for the overall outcome in these patients. Despite the current recommendations on regular BP measurement, hypertension in T1D children and adolescents is often underdiagnosed [2].
Although office BP measurement is considered the method of choice in diagnosing hypertension in children, an abnormal BP pattern can frequently go unrecognized. Ambulatory 24-hour BP monitoring (ABPM) provides more accurate insight into BP regulation, including at night, with more reproducible BP values compared to office BP measurements [3].
The seminal paper of Lurbe et al. [4] was first to show that an increase in nocturnal BP precedes the development of microalbuminuria in adolescents and young adults with T1D. Other studies later confirmed that alterations in nocturnal BP in particular seem to contribute to diabetes complications such as microalbuminuria [5,6]. Furthermore, Darcan et al. demonstrated an association between 24-hour diastolic BP load and incipient nephropathy in normotensive children and adolescents with T1D [7]. In addition, in a 6-year follow-up study in T1D children, kidney biopsy results showed more severe morphological changes in those with impaired BP regulation [8].
Besides standard ABP parameters, BP variability (BPV) has emerged as an established cardiovascular risk factor in adults. However, the data on its significance in the pediatric population, especially in T1D children, are deficient [9].
The aims of our study were: (1) to analyze the characteristics of ABP in T1D children, (2) to establish if there is an association between ABP parameters including BPV and different levels of albuminuria, and (3) to identify potential predictors of highnormal albuminuria and microalbuminuria in T1D children.
Materials and methods
1. Patients
This cross-sectional study included 201 T1D children and adolescents (111 girls and 90 boys) aged 5–20 years with duration of diabetes mellitus over 1 year. The patients were followed up at the Department of Pediatrics, Sestre Milosrdnice University Hospital Center, Zagreb, Croatia. Children and adolescents using medications that could affect BP or albuminuria (antihypertensive drugs, steroids, estrogens, nonsteroidal anti-inflammatory drugs) as well as patients whose ABPM did not meet the standardized requirements were not included in the study. None of the patients were in a honeymoon period.
Informed consent for participation in the study was obtained from all patients included in the study as well as from the parents for those under 18 years.
2. Methods
At the inclusion to the study, body height and weight were recorded and body mass index was calculated. All patients had their office BP measured followed by ABPM.
Office BP was measured using a sphygmomanometer device clinically validated to AAMI (Association for the Advancement of Medical Instrumentation) standards (DuraShock DS54 Thumbscrew; Welch Allyn, Skaneateles Falls, NY, USA). BP was measured in the seated position on the nondominant arm after a rest of 10 minutes minimum. There were three measurements with an interval of 3–5 minutes between measurements. The average of the last 2 measurements was used as patients' office BP. Office BP was defined as normal if all measurements were <90th percentile or <130/85 mmHg for 16 years and older; high-normal when BP was ≥90th and <95th percentile for age, sex and height or 130–139/85–89 mmHg for 16 years and older and as hypertension if BP was ≥95th percentile or ≥140/90 mmHg for 16 years and older according to the 2016 European Society of Hypertension guidelines [10].
ABPM was performed using the oscillometric device (Mobil-OGraph M01100120; I.E.M.GmbH, Stolberg, Germany) with adapted cuff size placed on the nondominant arm according to the current guidelines [11]. The accuracy of the automated measurements performed in each subject by the oscillometric device was verified with a sphygmomanometer at the beginning of the test period. The monitor was programmed to measure the BP at 15 min intervals during the day (07–22 hours) and at 30 minutes intervals during the night (22–07 hours). Children were asked to keep their arm relaxed during each daytime inflation. Each patient kept a diary of his/her daytime activities and recorded the actual sleep time period as well as the quality of sleep. All ABPM raw data were screened for errors. Values falling outside of the recommended range were excluded. ABPM was performed during a weekday including normal daily activities but avoiding vigorous exercises. ABPM was considered valid if there was a minimum of 58 (75%) BP readings over 24 hours with a minimum of one reading per hour, including during the sleeping period. The widely accepted normative data for ABPM from a European cohort were used [12]. Normal nocturnal dipping was defined as a decrease in both systolic and diastolic mean nocturnal BP of at least 10% from mean daytime systolic BP (SBP) and daytime diastolic BP (DBP). BPV was estimated as the standard deviation (SD) of the average of all valid measurements of SBP and DBP during 24-hour, daytime, and nighttime periods. The 24-hour BPV was not taken into account because the magnitude of nocturnal BP fall may blur the 24-hour SD of BP markedly [13]. Masked hypertension was defined as office BP below the 95th percentile and mean ambulatory BP over the 95th percentile with ≥25% BP load on ABPM [14]. White coat hypertension (WCH) was diagnosed if office BP was ≥95th percentile and mean ambulatory BP <95th percentile. Each patient's BP value was converted to a standard deviation score (SDS) using height- and gender-adjusted normative values [12].
Laboratory investigation at the time of ABPM included glycosylated hemoglobin (HbA1c) and serum creatinine. Urine albumin and creatinine were analyzed from the first morning spot sample on three occasions at three-month intervals.
The patient was considered microalbuminuric if a minimum of 2 out of 3 samples had an albumin/creatinine ratio (ACR) of 2.5–25 mg/mmol (22.1–221.2 mg/g) in males and 3.5–25 mg/mmol (30.9–221.2 mg/g) in females according to the ISPAD (International Society for Pediatric and Adolescent Diabetes) 2018 Guidelines [15]. Values above the upper limit of microalbuminuria denoted macroalbuminuria. Normoalbuminuric values were additionally classified as low-normal and high-normal albuminuria. Low-normal albuminuria was defined as lower tertile of normoalbuminuric range (ACR <0.83 mg/mmol or <7.35 mg/g in males and <1.1 mg/mmol or <9.73 mg/g in females) while high-normal albuminuria was defined as middle and upper tertile of normoalbuminuric range (ACR ≥0.83 and ≤2.5 mg/mmol or ≥7.35 and ≤22.1 mg/g in males and ≥1.1 and ≤3.5 mg/mmol or ≥9.73 and ≤30.9 mg/g in females). Albumin in the urine was measured by the immunonephelometric method (Behring Nephelometer Analyzer II, Siemens, Malvern, PA, USA). Urine and serum creatinine and HbA1c were determined by standardized biochemical methods.
Glomerular filtration rate was estimated by Schwartz formula for those up to 18 years while for adolescents over 18 years CKD-EPI formula was used. To determine the level of metabolic control for each patient, the average of HbA1c values in the last 12 months were used.
3. Statistical analysis
Normality of data distribution was tested using the Kolmogorov-Smirnov test. Comparison between groups was performed using the Student t-test for normally distributed variables, and Mann-Whitney U-test for not normally distributed variables. The Pearson correlation coefficient was calculated to assess the correlation between numerical variables. MedCalc version 10.4.0.0 (MedCalc Software, Ostend, Belgium) was used for the analysis. The simultaneous relationship of multiple prognostic factors with high-normal albuminuria as well as with microalbuminuria was determined using the multiple logistic regression model with a stepwise selection of the significant prognostic variables. Data are presented as the mean±SD. All tests were two-sided. A P-value of ≤0.05 was considered statistically significant.
Results
1. Characteristics of the study population
The characteristics of the study population are presented in Table 1. The mean age of the T1D subjects was 14.7±3.8 years with mean diabetes duration of 6.9±4.2 years (range, 1.1–16.4 years). Of 201 subjects, 158 (78.6%) had low-normal albuminuria, 36 (17.9%) had high-normal albuminuria and 7 (3.5%) had microalbuminuria. None of the subjects had macroalbuminuria. The average HbA1c of the whole group was 8.2%. Among them, 35.3% of subjects had HbA1c <7.5%, 44.2% had HbA1c ≥7.5 ≤9% and 20.4% had HbA1c >9%. Subjects with microalbuminuria had significantly higher HbA1c compared to children with normoalbuminuria (Mann-Whitney U-test, P=0.006). There was no difference in glomerular filtration rate between albuminuria subgroups.

Clinical and basic metabolic characteristics of the study population by the level of albuminuria
2. Office BP
According to the office BP measurements, 169 (84%) T1D children were normotensive, 17 (8.5%) had high-normal BP and 15 (7.5%) had stage 1 hypertension. None of the subjects had stage 2 hypertension or isolated systolic hypertension. Systolic but not diastolic office BP was significantly higher in microalbuminuric compared to normoalbuminuric subjects (Mann-Whitney U-test, P=0.034 and P=0.429, respectively) (Table 1).
3. Ambulatory BP monitoring
The 24-hour ABPM showed normal BP in 151 subjects (75.1%), prehypertension in 24 (11.9%), masked hypertension in 12 (6%) and WCH in 4 subjects (2%). The diagnosis of sustained ambulatory hypertension was confirmed in 10 (5%) subjects of which 7 (3.5%) had ambulatory hypertension and only 3 (1.5%) were classified as having severe ambulatory hypertension.
As a group, T1D subjects had elevated 24-hour SBP and DBP (+0.2 SDS and +0.3 SDS) as well as nighttime SBP and DBP (+0.6 SDS and +0.8 SDS) compared to reference values. Daytime DBP was lower in T1D subjects (-0.3 SDS) while daytime SBP did not differ from the reference values (0.0 SDS) (Fig. 1).
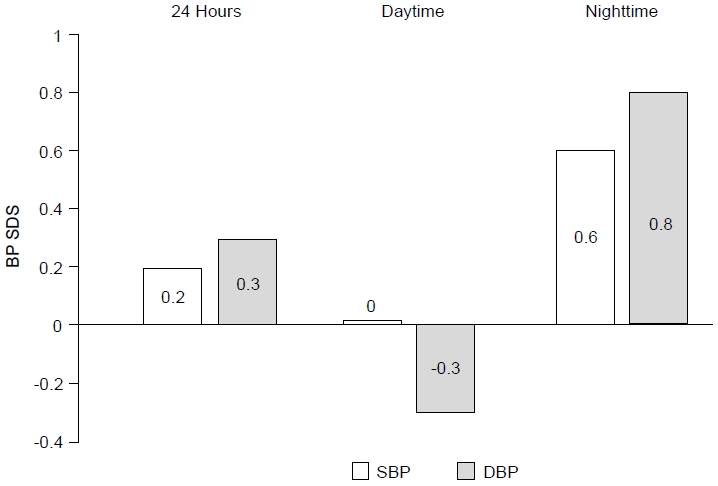
Ambulatory blood pressure (BP) of diabetic children and adolescents expressed as the standard deviation score (SDS). Zero SDS value represents the reference SDS value of the general pediatric population. SBP, systolic blood pressure; DBP, diastolic blood pressure.
Analysis of ABP by level of albuminuria showed no differences between patients with low-normal and high-normal albuminuria in any of the ABP parameters. However, patients with microalbuminuria had significantly higher 24-hour, daytime and nighttime DBP compared to normoalbuminuric subjects (low-normal+high-normal albuminuria) (Student t-test, P=0.03, P<0.01, and P<0.01, respectively) (Table 2).

Ambulatory blood pressure parameters of the study population by the level of albuminuria
In T1D children, average nocturnal dipping was reduced for SBP (8.1%±7.1%) but remained normal for DBP (14.8%±6.1%) without differences by the level of albuminuria (Table 2). Of 201 T1D subjects, 149 (74.1%) showed a nondipping pattern. Among them, 115 (77.2%) were systolic nondippers while 34 (22.8%) showed a nondipping pattern for both SBP and DBP. There were no isolated diastolic nondippers.
In our T1D children the average daytime BPV was higher than nighttime BPV and the systolic BPV was higher than diastolic BPV. There was no difference in BPV between the normoalbuminuric and microalbuminuric groups. Nighttime diastolic BPV was significantly higher in subjects with highnormal albuminuria compared to those with low-normal albuminuria (Student t-test, P=0.01) (Table 3).

Blood pressure variability of the study population by the level of albuminuria
A statistically significant weak correlation was found between ACR and the following ABP parameters: daytime DBP SDS (r=0.29; 95% confidence interval [CI], 0.15–0.41; P<0.001) and nighttime DBP SDS (r=0.21; 95% CI, 0.07–0.34; P=0.003).
A statistically significant weak correlation was also found between HbA1c and the following ABP parameters: 24-hour DBP SDS (r=0.23; 95% CI, 0.09–0.35; P=0.001), daytime DBP SDS (r=0.27; 95% CI, 0.14–0.40; P<0.001), and nighttime DBP SDS (r=0.25; 95% CI, 0.11–0.37; P<0.001).
4. Predictors of different levels of albuminuria
Significant independent prognostic factors for high-normal albuminuria selected with multivariate logistic regression were age (odds ratio [OR], 0.857; 95% CI, 0.773–0.949) and nighttime diastolic BPV (OR, 1.207; 95% CI, 1.023–1.425).
The only significant independent prognostic factor for microalbuminuria selected with multivariate logistic regression was nighttime DBP (OR, 5.608; 95% CI, 1.985–15.847). Neither diabetes duration nor HbA1c was selected as a significant independent predictor for high-normal albuminuria or microalbuminuria (Table 4).
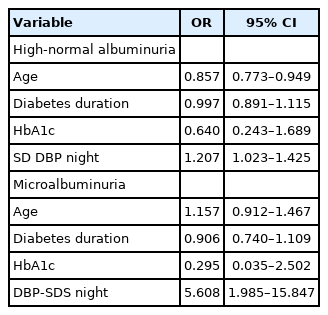
Predictors of high-normal albuminuria and microalbuminuria
Discussion
The main findings of our study are: (1) elevated 24-hour and nighttime SBP and DBP indicate impaired BP regulation in T1D children and adolescents, although most of them did not meet the criteria for diagnosis of sustained hypertension; (2) in T1D children and adolescents, nighttime DBP and diastolic BPV were significant independent prognostic factors for microalbuminuria and high-normal albuminuria, respectively.
BP values in our T1D children estimated according to the office BP measurements demonstrated a prevalence of hypertension (7.5%) similar to other studies. In the SEARCH study, which included 3,691 American diabetic children and adolescents, the prevalence of elevated BP (BP ≥95 percentile) was 5.9%, while in the German cohort it was 8.1% [16,17]. Interestingly, when using the 2017 American Academy of Pediatrics guidelines (data not shown), the percentage of hypertensive children in our cohort was slightly higher (8.7%) than the prevalence according to the ESH classification with a high percentage of children with elevated BP (22.2%) [11].
Our ABPM data were mainly in concordance with office measurements, although they revealed a notably lower prevalence of ambulatory hypertension (5%) compared to other studies in which prevalence of hypertension in T1D children was around 29% [18,19]. A possible explanation for the higher prevalence in other studies is that they included not only ambulatory 24-hour but also isolated daytime, nighttime or masked hypertension. The prevalence of masked hypertension in our group (6%) was also lower compared to other studies in T1D children and data from the general population with stated prevalence of 9.5%–12.4% [18-20]. The importance of diagnosing masked hypertension in children results from the fact that in youth, masked hypertension is a precursor of sustained hypertension and is associated with a risk of cardiovascular events and target organ damage comparable to sustained hypertension [21].
Data on the prevalence of WCH in T1D children are found in a wide range (between 3.7% and 32%) depending on the study population and timing of BP assessment, with higher prevalence when BP is assessed at the time of diagnosis instead of later during the follow-up [18,19]. In our subjects with duration of T1D >1 year, prevalence of WCH was rather low (2%), probably because our patients were in familiar surroundings that lacked the "white coat" effect. Research into the implications and longterm risk of WCH for children and adolescents is hindered primarily by the lack of follow-up. However, precaution is needed since some large adult studies demonstrated an increased risk for cardiovascular and all-cause mortality in subjects with untreated WCH [22].
Although most of the T1D subjects in our cohort were normotensive, the comparison of their ABP data with reference values revealed an altered BP pattern with elevated 24-hour and nighttime SBP and DBP. Similar to our results, Dost et al. [23] found elevated daytime SBP and nighttime SBP and DBP compared with the historic controls. The high prevalence of ABP abnormalities in T1D children including 24-hour, daytime and nighttime SBP, DBP and mean arterial BP indices was also observed in a recently published smaller Canadian study [24].
Several studies have confirmed that early changes in ABP occur concomitantly with a rise in ACR even within the normal albuminuria range, pointing to a possible link between impaired BP regulation and development of diabetic nephropathy. Gallego et al. [25] found that patients with high-normal ACR had higher daytime and nighttime SBP and DBP compared to those with low-normal ACR, while Marcovecchio et al. demonstrated that increasing albumin excretion, even in the normal range, may be associated with parallel rises in ABP [26].
Our results did not confirm the differences in ABP between high- and low-normal albuminuria groups, but did demonstrate significantly higher DBP in all periods of ABPM in microalbuminuric subjects compared to those with normoalbuminuria. Furthermore, correlation analysis confirmed a positive association between DBP and ACR in our T1D subjects. In another recently published study by Saygili et al. [27], a 24-hour mean arterial BP-SDS was the only independent risk factor for microalbuminuria. They also found that high averaged HbA1c is independently associated with higher daytime and nighttime SBP-SDS and nighttime DBPSDS. Similarly, our study confirmed a correlation between HbA1c and DBP in all time periods. It might be concluded that metabolic control and BP regulation in T1D children are closely correlated and impact the development of diabetic nephropathy.
Altered ABP profiles in microalbuminuric T1D children were also observed in the study by Dost et al., where higher nocturnal BP was identified as a marker of microalbuminuria [23]. In our study nighttime DBP was determined as a predictor of microalbuminuria while nighttime diastolic BPV and younger age were predictors of high-normal albuminuria. Contrary to some authors, in our study diabetes duration was not identified as a factor influencing the presence of microalbuminuria or high-normal albuminuria, supporting some earlier reports [23,28].
Although the patterns of ABP profiles in T1D patients are not uniform and might differ slightly between the studies, the vast majority of research confirms that abnormal BP regulation and its association with rising levels of albuminuria indicates the need for regular BP controls in T1D children and early intervention in cases of confirmed hypertension.
Factors involved in the altered BP circadian rhythm in diabetic patients are not fully understood. Blunted nocturnal dipping (nocturnal BP fall <10% from diurnal levels) is a wellestablished prognostic risk factor for unfavorable cardiovascular outcomes and target organ damage in adults, including diabetics [29]. Its prognostic value in the pediatric population is not clearly determined mostly because of the lack of follow-up studies. In T1D children a loss of the nocturnal SBP dip may be a sensitive marker for incipient diabetic nephropathy [4]. The percentage of nondipping in T1D children differs between studies, but in most it is rather high, ranging from 41.2% to as high as 70.4% [7,18,19,26]. Our results even exceed those values (74.1%), indicating a very high proportion of children with the additional cardiovascular risk factor of nondipping.
The assessment of BPV allows for a more comprehensive evaluation of BP. In adults, BPV plays an important role in the progression of target organ damage and the triggering of vascular events [30]. Moreover, the evidence shows that an increased BPV in childhood is predictive of adult hypertension [31]. The literature on BPV in children is rather scarce, especially in T1D children. Further, the reference values on BPV in children are lacking. BPV in our T1D children was similar to the values in children with primary and secondary hypertension and was higher for both systolic and diastolic variability (from 0.1 SDs for nighttime diastolic BPV to 1.3 SD for daytime diastolic BPV) when compared to another study of T1D children, although none of these values exceeded either 16 mmHg daytime SD SBP or 12.2 mmHg nighttime SD SBP, which are the suggested cutoffs for greater risk of cardiovascular events in adults [23,32-34]. Data on higher BPV that describe the fluctuations of BP between measurements is important as it presents the state of elevated cardiovascular risk even in the absence of hypertension. In our cohort, nighttime diastolic BPV was a significant independent prognostic factor for high-normal albuminuria. Since there are no similar data in the literature, these results and their clinical relevance need to be tested in future studies.
Similarly, in Dost et al. [23] the difference in BPV was compared between normoalbuminuric and microalbuminuric T1D patients and a significant difference was confirmed for daytime diastolic BPV.
The present study has several limitations. First, there was no control group and ABPM values had to be compared with reference values, although each patient's BP value was converted to a SDS using height- and gender-adjusted normative values. Second, our T1D group was quite heterogeneous in terms of age and disease duration and third, our microalbuminuria subgroup was relatively small therefore statistical power for these results is limited.
In conclusion, our results show that T1D children and adolescents have impaired BP regulation even though most of them do not fulfill the criteria for hypertension, indicating higher cardiovascular risk despite mostly normal office BP. In T1D children we also found an association not only between diastolic ABP but also BPV with rising levels of albuminuria pointing to a clear connection between BP and incipient diabetic nephropathy.
Office BP measurement is a part of standard follow-up in T1D children and adolescents but has many limitations. It does not provide information on circadian rhythm, nocturnal BP dipping, BPV or the presence of masked hypertension, which are all known cardiovascular risk factors. Performing ABPM provides additional valuable data on BP regulation and enables early intervention in cases of altered ABP parameters. Therefore, whenever possible ABPM should become a part of the routine diagnostic procedure in pediatric T1D patients.
Ethical statement
Ethical approval was given by the Ethics Committee of Sestre Milosrdnice University Hospital Center, Vinogradska 29, 10000 Zagreb, Croatia (approval number: 4433/15-19).
Notes
Conflicts of interest
No potential conflict of interest relevant to this article was reported.
Funding
This study received no specific grant from any funding agency in the public, commercial, or not-for-profit sectors.
Data availability
The data that support the findings of this study can be provided by the corresponding author upon reasonable request.
Author contribution
Conceptualization: BVM, GS; Data curation: BVM, LLG, GS; Formal analysis: BVM, IŠ, LLG; Methodology: BVM, IŠ, LLG; Project administration: BVM; Writing - original draft: BVM; Writing - review & editing: BVM, IŠ, LLG, GS