


Highlights
· The feasibility of deep-learning-based bone age software was evaluated using the real-world data. Despite efforts to improve its performance, the bone age software exhibited a low concordance rate and an inclination to underestimate the bone age in healthy Korean children.
Introduction
Growth evaluation is crucial in assessing the health status of children because diseases often cause growth attenuation. The bone age (BA) estimation is a time- and cost-effective approach to evaluate growth, sexual maturity, treatment follow-up, and adult height prediction, particularly for children with endocrine or metabolic disorders [1].
Since the 1950s, researchers in various fields have evaluated the manners in which artificial intelligence can assist human life. Machine learning is a subfield of artificial intelligence in which algorithms are based on pattern learning from data. Deep learning (DL), a class of machine learning, has recently been applied and has gained success in medical imaging in several clinical settings [2,3].
For over 60 years, the interpretation of hand radiographs has been based on conventional methods. Conventional BA estimation methods include the Greulich-Pyle and Tanner-Whitehouse 3 methods [4,5]. Both of these methods require a considerable amount of time and can sometimes be subjective, and the accuracy depends on the experience of pediatricians and radiologists.
Efforts have recently been made to apply DL to hand x-ray readings for BA estimation [6]. Several studies have assessed the efficacy of DL for x-ray interpretation using radiographs from children with disorders such as precocious puberty, short stature, or delayed puberty. Such studies have investigated the clinical performance of DL-based BA software compared to that of radiologists. Hence, we aimed to evaluate the clinical performance and the accuracy of DL-based BA software in healthy Korean children.
Materials and methods
1. Subjects
We reviewed the medical records of 371 healthy children (217 boys and 154 girls) aged 4–17 years who visited the Pediatric Endocrinology Clinic at Korea University Guro Hospital between January 2017 and December 2018 for growth evaluation. The children visited the hospital for a health checkup without any symptoms of other diseases. Children with diseases that can delay or advance BA, such as growth hormone deficiency, skeletal dysplasia, or precocious puberty, were excluded from the estimation. Of the 6,061 left-hand radiographs taken during the study period, 5,508 were excluded and 553 were used for analysis.
2. Methods
Data regarding chronological age (CA), sex, weight, height, and body mass index (BMI, kg/m2) and left-hand radiographs of each child were collected. The weight, height, and BMI were expressed as the standard deviation score (SDS) for Korean children based on their age and sex using the 2017 Korean growth standard. A total of 553 left-hand radiographs (332 radiographs of boys and 221 radiographs of girls) from 371 healthy Korean children were independently evaluated by pediatricians (pediatric endocrinologists) and radiologists (musculoskeletal radiologists). The DL-BA software was evaluated using the Greulich-Pyle method. The pediatricians and radiologists estimated the BA without knowledge of the CA.
A commercial DL-based BA software (BoneAge ver. 1.0.3, VUNO Med, Seoul, Korea) was used. This software was developed according to a convolutional neural network and gained approval from the Korean Ministry of Food and Drug Safety in 2018. The software displays the 3 most likely estimated BAs along with their corresponding probabilities (Fig. 1). In Fig. 1, the software analyzed left-hand radiographs of a girl whose CA was 12 years and 0 months. Based on its analysis, it generated an attention map using the shape and density of each bone and then displayed the 3 most likely estimated BAs along with their corresponding probabilities. The first-rank BA of this girl was 11 years and 0 months with a probability of 88.39%. We used the CA as the reference value. The difference between the CA and BA (CA–BA) for each child was calculated by subtracting the BAs (that were estimated by a pediatric endocrinologist and a radiologist) from the corresponding CA value estimated by the software. Therefore, positive values indicated a BA delay, while negative values indicated BA maturation.
3. Statistical analysis
All statistical analyses were performed using R software ver. 3.6.1 (R studio, Boston, MA, USA). The 2-sample t-test and Fisher exact test were used to compare the CAs with the BAs estimated by the DL software. Pearson correlation coefficient and the root mean squared error (RMSE) were used to evaluate the clinical performance of the software by comparing the CAs with each BA estimated by the pediatricians, radiologists, and software. The RMSE is the square root of the average of squared errors; the smaller is the RMSE, the closer are the CA and the estimated BA [7]. Pearson correlation coefficient and the RMSE were also evaluated for the BAs estimated by the pediatricians, radiologists, and software for each child. The intraclass correlation coefficients for the pediatricians, radiologists, and software were calculated to assess interobserver reliability. The concordance rate based on a 12-month cutoff was used to assess the accuracy. One-way analysis of variance was performed to compare the differences according to the CA. Furthermore, the Bland-Altman plot was used to assess differences between the CA and the estimated BA for each pediatrician, radiologist, and the software. All statistical analyses were performed separately for boys and girls. The data are expressed as mean±standard deviation. P-values < 0.05 were considered to be statistically significant.
Results
1. Patient Characteristics
A total of 553 left-hand radiographs was obtained from 371 healthy Korean children. Their mean CA was 9.8±2.8 years (10.1±3.0 years for boys and 9.4±2.4 years for girls). The mean height, weight, and BMI SDSs were -0.8±0.8, -0.6±1.0, and -0.3±1.0 for boys, respectively, and -0.9±0.9, -0.8±0.9, and -0.5±1.0 for girls (Table 1).
The mean BA assessed by the pediatricians was 9.6±3.1 years (9.7±3.4 years for boys and 9.4±2.7 years for girls), and the CA–BA was 2.6±4.1 months (4.6±4.8 months in boys and -0.3±3.4 months in girls). The mean BA assessed by the radiologists was 9.6±3.1 years (9.8±3.4 years for boys and 9.3±2.6 years for girls), and the CA–BA was 2.3±3.4 months (3.1±4.0 months in boys and 1.1±2.6 months in girls). Finally, the mean BA assessed by the software was 9.1±3.4 years (9.2±3.6 years for boys and 8.9±2.9 years for girls), and the CA–BA was 8.5±6.8 months (10.2±7.2 months in boys and 6.1±6.5 months in girls) (Table 1).
2. Clinical performance of the software for children
There was a significant difference between the CAs and the software-estimated BAs in the 2-sample t-test (P<0.001) and Fisher exact test (P=0.011). There was a good correlation between the CAs and the software-estimated BAs (r=0.957, P<0.001); however, the RMSE was the highest (15.4 months), and the concordance rate was the lowest (58.8%) using a 12-month cutoff. Notably, only the software showed a difference of more than 12 months (P=0.771).
The intraclass correlation coefficient was the highest for the software and pediatricians, with a value of 0.981 (95% confidence interval [CI], 0.977–0.984; P<0.001) for the total group of children. The RMSE was the lowest between pediatricians and radiologists (7.6 months), and the concordance rate was the highest (95.3%) with a 12-month cutoff (data not shown) (Fig. 2).
There was a good correlation between the CAs and the software-estimated BAs for both boys and girls (r=0.961, P<0.001 and r=0.852, P<0.001, respectively). However, the RMSE was the highest, at 16.6 months and 13.3 months, and the concordance rate was the lowest, at 53.0% and 67.4%, with a 12-month cutoff for boys and girls, respectively. In girls, the CA–BAs estimated by pediatricians, radiologists, and the software were within 12 months (P<0.001, P<0.001, and P=0.003, respectively); in contrast, in boys, the software showed differences of more than 12 months (P=0.998) (data not shown).
The intraclass correlation coefficient was the highest for the software and the pediatricians, with values of 0.984 (95% CI, 0.980–0.987; P<0.001) for boys and 0.974 (95% CI, 0.966–0.980; P<0.001) for girls. The RMSE values were the lowest between pediatricians and radiologists, at 7.5 months and 7.7 months for boys and girls, respectively. The concordance rates were the highest, at 94.9% and 95.9%, with a 12-month cutoff for boys and girls, respectively (Table 2).
3. Differences in BA analysis among pediatricians, radiologists, and the software
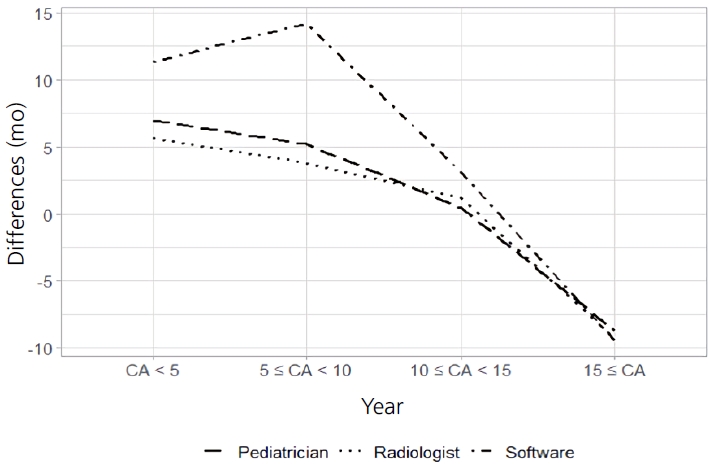
The Bland-Altman plot revealed a general tendency of underestimating the BA with a decrease in the CA. This tendency was observed for all pediatricians, radiologists, and the software. Nevertheless, this trend was more significant with the software than it was with the pediatricians and radiologists. The software estimated the BA to be much lower than the CA, especially for children under the age of 8.3 years (mean difference, 14.3 months; P<0.001). The pediatricians and radiologists also estimated the BA to be lower than the CA in children under the age of 5.0 years (mean difference, 6.9 months; P<0.001; and mean difference, 5.6 months; P=0.001; respectively) (Fig. 3).
Discussion
This retrospective study investigated the accuracy of the BA software compared to that of estimations performed by pediatricians and radiologists via the Greulich-Pyle method. The CA estimates correlated well with the 3 BAs estimated by pediatricians, radiologists, and the software. The software was upgraded with improved accuracy after conducting preliminary research. Despite efforts to improve its performance, the BA software exhibited a low concordance rate and an inclination to underestimate the BA in healthy Korean children.
DL is the latest manifestation of artificial intelligence. One notable aspect of DL is its ability to detect images without relying on human performance; consequently, it is widely applied to mammograms, computed tomography, and magnetic resonance imaging, as well as hand x-rays [8-10].
The BA corresponds to the degree of bone maturation, which varies as the bones of the hands change in shape and size as children mature [11,12]. Many factors influence bone maturation, including genes, nutrition, hormones, and diseases. The left hand and wrist are the most commonly employed sites for BA estimation [13]. Hand radiographs have traditionally been interpreted using standardized methods. The Greulich-Pyle method compares the appearance of the hand with references; thus, it is simple, fast, and prevalently used. The Tanner-Whitehouse 3 method calculates the sum of the radius, ulna, and short bone scores; thus, it is more accurate than is the Greulich-Pyle method but also more time-consuming. Both conventional methods were derived primarily based on white American and British populations between 1930 and 1990. In Korean children, BAs are also accurately estimated using both the Greulich-Pyle and Tanner-Whitehouse 3 methods, which correlate well with the CAs [14].
A DL model was also applied to estimate skeletal maturity, and its accuracy was similar to that of an expert radiologist [15]. The RMSE without augmentation was 1.45 years for boys and 1.51 years for girls based on 8,325 automatically extracted radiographs from children aged 5–18 years. Further, the test accuracy of DL was 61.40% for boys and 57.32% for girls [16]. Kim et al. [17] reported that the BA software enhanced the efficiency (from 63.0% to 72.5% and from 49.5% to 57.5% per reviewer) and reduced reading times (by 18.0% and 40.0%), with no consideration of the diagnostic accuracy, for 200 children aged 3–17 years. In our study, there was a good correlation between the BAs estimated by the pediatricians, radiologists, and the software; however, the RMSE was the highest (15.2 months) and the concordance rate was the lowest (58.8%) using a 12-month cutoff in the case of the software. Notably, only the software showed differences of more than 12 months.
The evaluation of BA radiographs is not only performed in healthy children for screening purposes, but also in children with endocrine disorders such as precocious puberty, short stature, or delayed puberty. Previous studies only evaluated radiographs without checking for combined disorders, and children with disorders were highly likely to be included [16,17]. In our study, we only included healthy Korean children ranging from preschool age to adolescence.
The clinical performance of computer-aided detection of interstitial lung diseases was as high as 85.5% [18]. Another study showed that DL could classify 137 pulmonary tuberculosis cases from 150 chest radiographs, and a radiologist-augmented approach resulted in improved accuracy with a sensitivity of 97.3% and specificity of 100% [19]. In contrast to our expectations, the accuracy of a software-based BA estimation based on x-rays is low compared to other estimations using different imaging modalities.
It may be necessary to consider sexual maturation and other clinical features for accurate BA estimation because skeletal maturation is not linear due to rapid changes that occur during normal childhood and adolescence [20]. Pediatric endocrinologists have traditionally analyzed hand radiographs based on the belief that radiologists who are unaware of the clinical features of the child may inaccurately interpret such radiographs. A discrepancy ranging from -1.5 to 3.5 years with a mean of 4±12 months was observed between a pediatrician and radiologist who analyzed 103 hand x-rays [21]. In our study, the RMSE was the lowest and the concordance rate was the highest between pediatricians and radiologists.
In this study, the Bland-Altman plot showed that the BAs in children of younger CAs were underestimated by the pediatricians, radiologists, and the software. This underestimation was statistically significant under the age of 8.3 years and was much higher in boys than in girls. This finding coincided with the difficulty of performing BA estimations for young boys in a clinical setting. Maturation disparities are common in healthy children and can lead to clinically inaccurate assessments of BA. For instance, Chinese children were found to have slower maturation in the metacarpals compared to that in the phalanges [22]. This discrepancy could contribute to an underestimation of BA in young boys.
Since the BA does not necessarily coincide with the CA even in healthy children, our results should be interpreted with caution. However, this study may be helpful to identify the differences between the BAs estimated by pediatricians, radiologists, and software.
Our study has several limitations. First, radiographs from children ages 0–3 years and older than 18 years were excluded because they were too few in number and may have caused low accuracy. Second, although the Greulich-Pyle method entails significant interobserver and intraobserver variability, our study did not include intraobserver variability.
In conclusion, the DL-based BA software showed a low concordance rate and a tendency to underestimate the BA compared to the CA in healthy Korean children. The inclusion of more images and development of an improved DL technique are required to increase the estimation accuracy.