


Highlights
· Sodium glucose cotransporter-2 inhibitors (SGLT2i) use leads to significantly lower glycosylated hemoglobin without increase in adverse effects in children and young adults with type 2 diabetes mellitus.
· SGLT2i use in type 1 diabetes mellitus (T1DM) leads to increased time-in range with a reduction in insulin dosage.
· SGLT2i use in T1DM leads to increased beta hydroxybutyrate levels but this does not translate to increased occurrence of diabetic ketoacidosis.
Introduction
The U.S. Food and Drug Agency (FDA) approved the use of sodium-glucose cotransporter-2 inhibitors (SGLT2i), specifically empagliflozin, for the treatment of type 2 diabetes mellitus (T2DM) in children aged 10 years or older on June 20, 2023 [1]. The exponential increase in the burden of obesity in the general population and specifically in children in the last few decades has given rise to the new problem of T2DM in children. A recent systematic review of data from 8,942 children with T2DM documented the prevalence of obesity in these children at the time of diagnosis of T2DM to be 77.24% (95% confidence interval [CI], 70.55%–83.34%) [2]. A recent meta-analysis of data from 228,184 children reported that the prevalence of T2DM in obese children was 1.3% (95% CI, 0.6%–2.1%), which is 13 times the prevalence in normal weight children (0.1%; 95% CI, 0.01%–0.2%) [3]. The approval of empagliflozin by the FDA is likely to exponentially increase the use of SGLT2i in children with T2DM.
The glycemic efficacy of SGLT2i as antidiabetes medications has been well established across the globe with clinical use spanning more than a decade. However, the tolerability and side-effect profiles of this class has drugs has prevented their widespread used in in children with diabetes, specifically T2DM. SGLT2i have been tried in children with type 1 diabetes mellitus (T1DM), especially in those who are overweight or obese [4,5]. More recently, SGLT2i have been used to treat nondiabetic conditions in children such as congenital severe insulin resistance syndromes [6,7], neutropenia in children with glycogen storage disease type 1b [8], Prader Willi syndrome [9], heart failure [10], and hereditary proteinuric kidney disease [11].
It is therefore critically important to document the safety and tolerability of use of SGLT2i in children with different clinical conditions before more extensive use in clinical practice. A literature review revealed that to date, no meta-analysis evaluating the safety and tolerability of SGLT2i in children has been published. Hence, our aim in this systematic review and meta-analysis was to evaluate the safety and tolerability of SGLT2i use in children.
Materials and methods
The meta-analysis was carried out according to the recommendations of the Cochrane Handbook for Systematic Reviews of Interventions and followed the PRISMA (Preferred Reporting Items for Systematic Reviews and Meta-Analyses), the filled checklist of which can be found at the end of the manuscript [12]. The predefined protocol was registered in PROSPERO under registration number CRD42023439736. All randomized controlled trials (RCTs), case control studies, and cohort studies published till May 2023 were considered for this systematic review. Since ethical approval already exists for the individual studies included in the meta‑analysis, no separate approval was required for this study. PICOS (Population, Intervention, Comparison, Outcomes, and Study) criteria were used to screen and select studies for this systematic review. Only children and young adults receiving any SGLT2i for a clinical condition such as T2DM, T1DM, insulin resistance syndrome, cardiac disease, and renal disease were considered for this systematic review. Adults (individuals older than 25 years) were excluded from this study.
The primary outcome was the occurrence of treatment emergent adverse events (TAEs). The secondary outcomes of this study were the occurrence of severe adverse events (SAEs), hypoglycemia, euglycemic ketosis, hyperglycemic ketosis, genital infections, urinary tract infections (UTIs), pyelonephritis, any other adverse event reported, glycemic efficacy in children with diabetes, and any other pleotropic benefit documented.
Electronic databases of MEDLINE (via PubMed), Embase (via Ovid SP), Cochrane central register of controlled trials (CENTRAL) (for trials only), ctri.nic.in, clinicaltrials.gov, global health, and Google scholar were searched using the following Boolean search strategy: "(SGLT2) OR (dapagliflozin) OR (empagliflozin) OR (sodium glucose co-transporter 2)" AND "(children) OR (adolescent)". Data extraction was carried out independently by 2 authors. Details of data extraction are described in a previous publication from our group [13]. Three authors independently assessed the risk of bias using the risk of bias assessment tool in Review Manager (Revman) version 5.4 (The Cochrane Collaboration, Oxford, UK 2014) software as described previously [14]. For continuous variables, outcomes were expressed as mean differences (MDs). For dichotomous outcomes (treatment success), results were expressed as odds ratios (ORs) with 95% confidence intervals (CIs). RevMan 5.4 was used to compare the MDs of different primary and secondary outcomes. Data were pooled in random effect models to analyze primary and secondary outcomes. Outcomes were expressed as 95% CI. Heterogeneity was initially assessed by studying Forest plots generated for the primary and secondary outcomes of this study. Subsequently heterogeneity was analyzed using a chi-square test with N-1 degrees of freedom [15]. Details of these analyses are provided in our previous publications [13,14]. Overall grading of the evidence (certainty of the evidence) related to each of the primary and secondary outcomes was done using the GRADE (Grades of Recommendation, Assessment, Development and Evaluation) approach [16] as described previously [14]. GRADEpro Guideline Development Tool software (McMaster University and Evidence Prime Inc, 2015) was used to create the summary of findings table for this meta-analysis.
Results
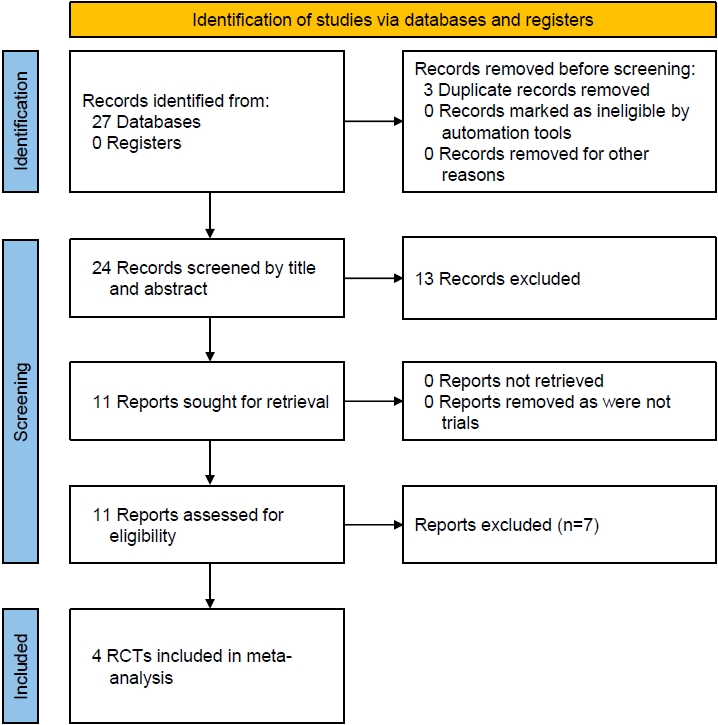
Three duplicate articles were removed from the initial set of 27 articles found after the initial search (Fig. 1). Further screening of titles, abstracts, and full-texts reduced our search down to 11 studies which were evaluated in detail (Fig. 1). Data from 4 trials involving 177 individuals with T2DM and 81 individuals with T1DM were analyzed. The RCT by Laffel et al. [18] was included in the meta-analysis as it evaluated the efficacy of empagliflozin in children with T2DM as compared to placebo and linagliptin. The RCT by Tamborlane et al. [19] was also included in the meta-analysis as it evaluated the efficacy and safety of dapagliflozin as compared to placebo in children with T2DM. Biester et al. [20,21] evaluated the safety and efficacy of dapagliflozin in addition to insulin therapy in patients with T1DM. Baseline characteristics of the studies included in the analysis are depicted in Table 1. Laffel et al. [22] and Tirucherai et al. [23] evaluated the pharmacokinetics and pharmacodynamics of empagliflozin and dapagliflozin, respectively, in T2DM, but did not have a control arm and their studies were therefore excluded from the meta-analysis. Studies by Grünert et al. [8] and Halligan et al. [24] were observational studies evaluating the safety and efficacy of empagliflozin in children with glycogen storage disease type 1b. Cui et al. [11] evaluated the safety and efficacy of dapagliflozin in children with inherited proteinuric kidney disease. Newland et al. [10] studied the impact of dapagliflozin in pediatric heart failure. Dapagliflozin was found to be useful in young obese children with T1DM with regards to reduction in body weight, glycemic control, and insulin requirements [25]. Studies excluded from analysis are summarized in Table 2.
1. Risk of bias in the included studies
Supplementary Fig. 1A and B elaborate the risk of bias. All 4 studies included in the meta-analysis were at low risk for random sequence generation, allocation concealment bias, performance bias, detection bias, attrition bias, and reporting bias (100%). Source of funding, especially pharmaceutical industry funding, defined as one or more authors from the pharmaceutical organization involved in the development of the drug, involvement of pharmaceutical organization in data analysis and manuscript preparation, or conflicts of interest were evaluated in the "other bias" section. All 4 studies were at high risk for this type of bias (100%).
2. Effects of SGLT2 inhibitors on primary and secondary outcomes
1) T2DM: safety and efficacy of SGLT2 inhibitors in T2DM
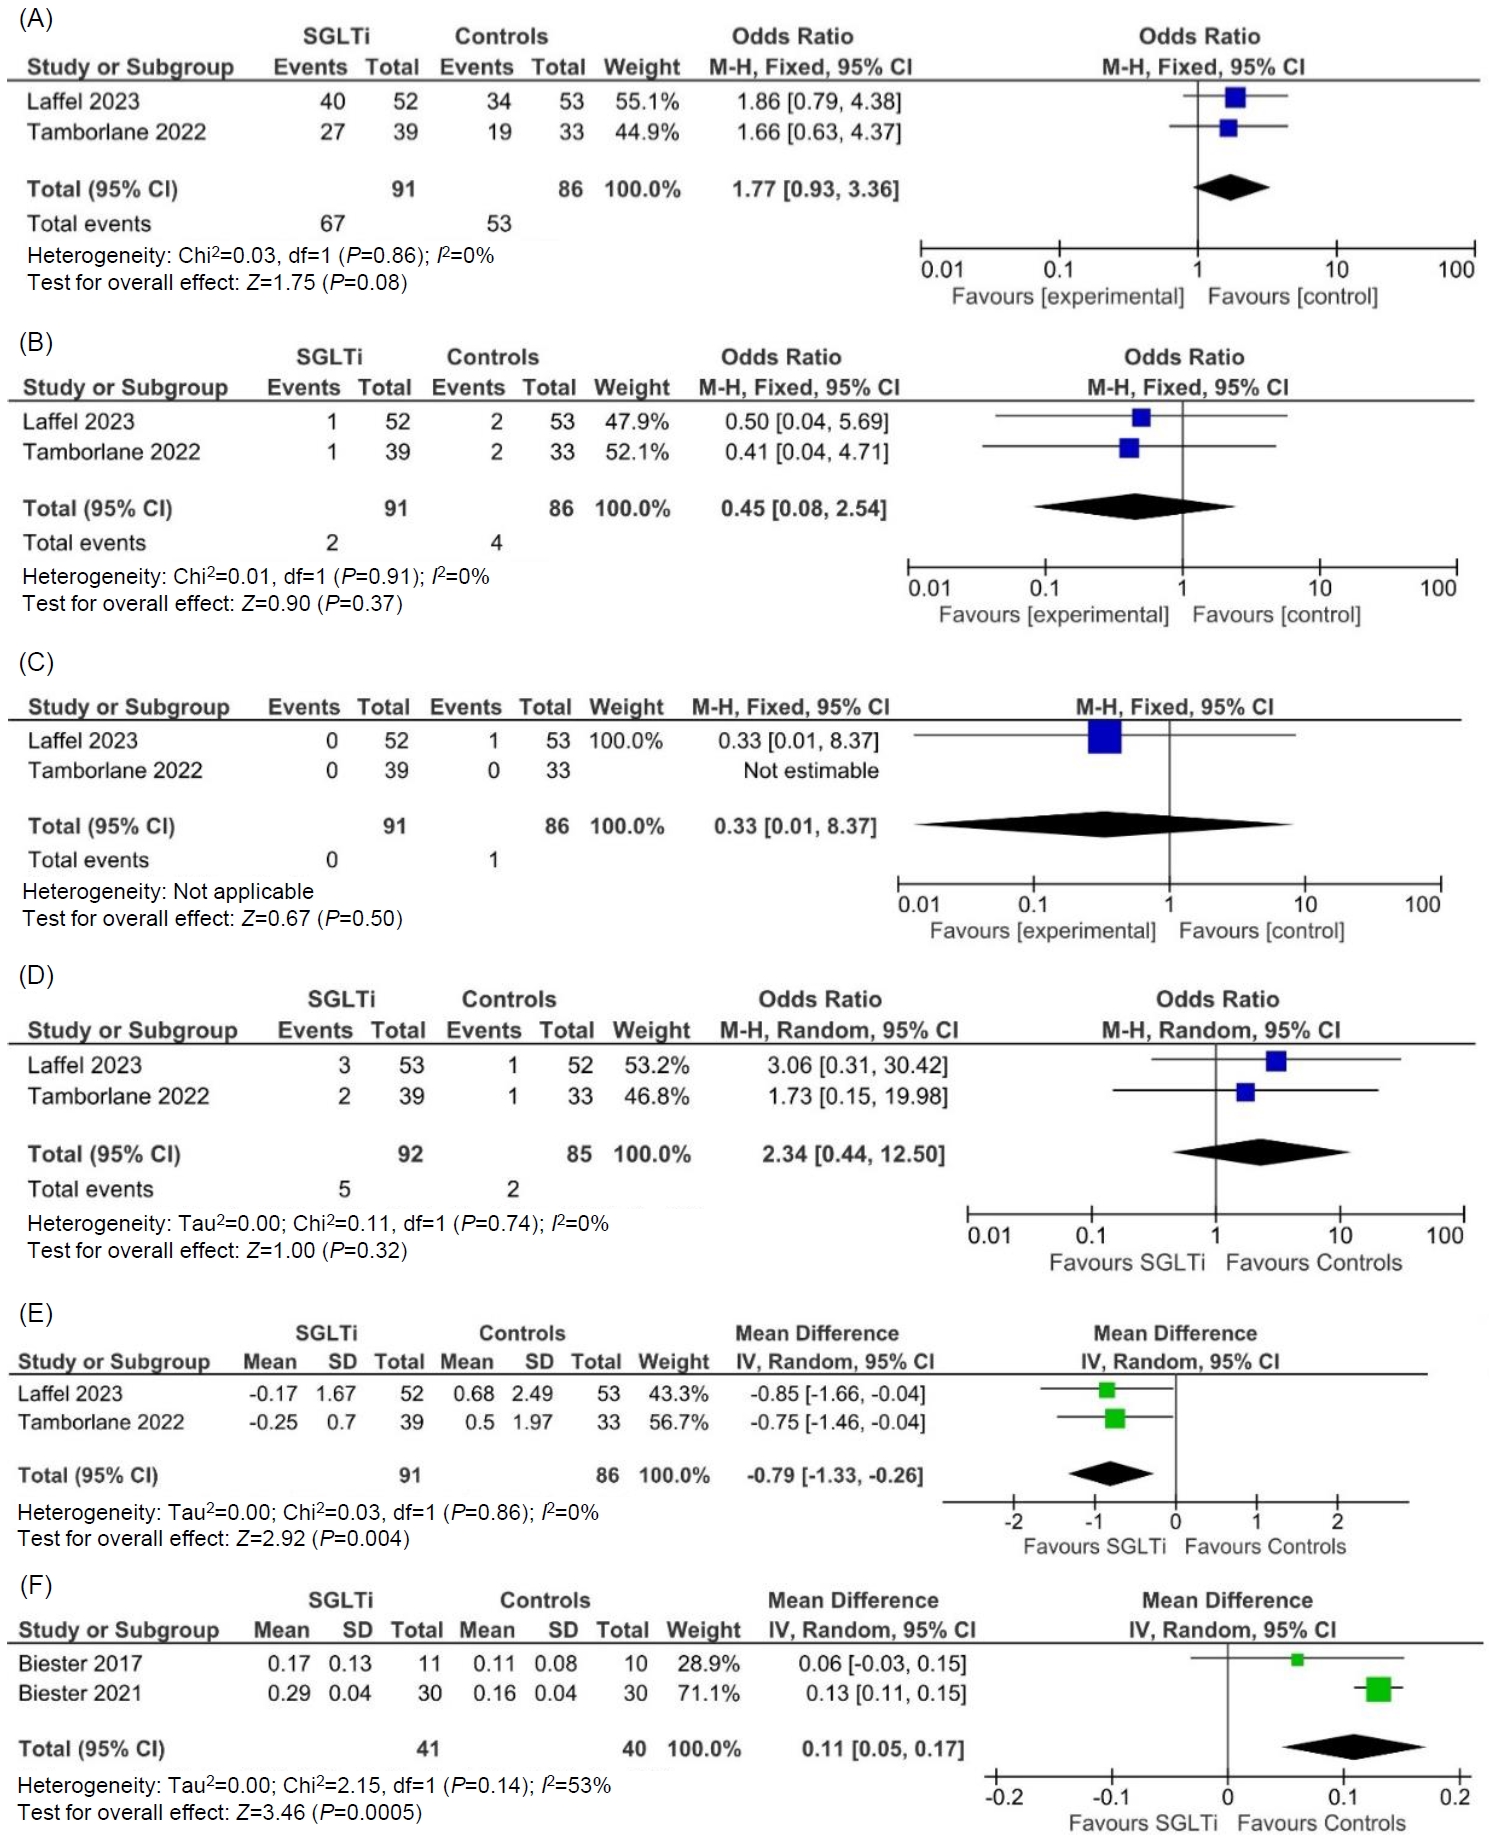
The occurrence of treatment emergent adverse events (TAEs) (OR, 1.77; 95% CI, 0.93–3.36; P=0.08; I2=0%; low heterogeneity [LH]; high certainty of evidence (HCE); Fig. 2A), serious adverse events (SAEs) (OR, 0.45; 95% CI, 0.08–2.54; P=0.37; I2=0%; LH; HCE; Fig. 2B), diabetic ketoacidosis (OR, 0.33; 95% CI, 0.01–8.37; P=0.50; HCE; Fig. 2C), UTIs (OR, 2.34; 95% CI, 0.44–12.50; P=0.32; I2=0%; LH; HCE; Fig. 2D), and severe hypoglycemia requiring assistance (OR, 4.47; 95% CI, 0.21–96.40; P=0.34; HCE) were comparable among patients receiving SGLT2i as compared to placebo.
As compared to placebo, patients receiving SGLT2i had significantly lower HbA1c at 24–26 weeks (MD, -0.79%; 95% CI, -1.33 to -0.26; P=0.004; I2=0%; LH; HCE; Fig. 2E).
2) T1DM: safety and efficacy of SGLT2 inhibitors in T1DM
Beta hydroxybutyrate levels were significantly higher in the SGLT2i group than the placebo group (MD, 0.11 mmol/L; 95% CI, 0.05–0.17; P=0.0005; I2=53%; moderate heterogeneity; moderate certainty of evidence; Fig. 2F). There was no occurrence of SAEs, diabetic ketoacidosis, or severe hypoglycemia in the treatment or placebo groups.
Time-in-range was considerably greater in the SGLT2i group than the placebo group (68%±6% vs. 50%±13%, P<0.001), and nocturnal glucose was significantly lower with dapagliflozin (6.2±0.7 mmol/L vs. 7.3±1.7 mmol/L, P=0.003) without an increase in time-below-range [20]. In another study, regardless of baseline HbA1c, mean total insulin dosage over the course of 24 hours was significantly lower (P<0.0001) following SGLT2i therapy than placebo administration (0.92 U/kg/24 hr vs. 1.10 U/kg/24 hr), representing a mean reduction of -13.6% [21]. Funnel plots drawn to assess publication bias are presented in Supplementary Fig. 2. Key outcomes of this study are described in Table 3.
Discussion
In a population-based study from India involving data from 35,830 adolescents, the prevalence of prediabetes or diabetes was 12.3% and 8.4%, respectively [26]. An exponential increase in the prevalence of obesity among adults and kids following the coronavirus disease 2019 (COVID 19) pandemic has contributed to the increased prevalence of T2DM in children. A network meta-analysis published in 2022 highlighted that metformin, saxagliptin, linagliptin, exenatide, liraglutide and dapagliflozin have been evaluated in different clinical trials in children with T2DM and advocated for the use of the saxagliptin metformin combination to treat T2DM in children [27]. Saxagliptin use has decreased significantly in adults with T2DM following the issue of a black box warning for heart failure [28]. Since then, many more studies have been published on oral antidiabetes medication use in children, especially SGLT2i like empagliflozin.
In a phase 2 study involving 24 children (10–17 years old) with T2DM, dapagliflozin was shown to have pharmacokinetics and pharmacodynamics in children similar to that of adults, indicating no need for dose adjustment with regard to dapagliflozin use in children [23]. A similar study of 27 children aged 10–17 years with T2DM demonstrated empagliflozin had similar pharmacokinetics and pharmacodynamics in children as were observed in adults, indicating no need for dose adjustment with regards to empagliflozin use in children [22].
Our analysis indicated that use of SGLT2i (dapagliflozin and empagliflozin) in children with both T1DM and T2DM is safe. SGLT2i are in general well tolerated in children and have a side-effect profile similar to that noted in adults. Though it is plausible that increased urinary glucose excretion brought about by SGLT2i can cause a UTI, the incidence of UTIs was similar in the treatment and placebo groups of children with T2DM. Though β hydroxybutyrate levels were significantly higher in the SGLTi group than the placebo in T1DM, this elevation was mild and was not severe enough to cause DKA. Health advantages of modest hyperketonemia are also possible. The mild hyperketonemia brought on by the SGLT2i metabolic substrate shift observed in the current study as well as the rapid onset of cardiovascular disease benefits in the EMPA-Reg trial may be directly related to β-HBA being freely taken up by the heart among other organs and oxidized in preference to fatty acids, and it will be interesting to see if this applies to T1DM subgroups as well [29]. Patients with T1DM with metabolic syndrome on SGLT2i are at higher risk of euglycemic ketosis during sick days. Sick day guidelines should therefore be more efficiently implemented during those days in patients with a low threshold for increasing the total daily insulin dose requirements, and if needed, SGLT2i should be withheld for a few days until the patient recovers [30].
Current diabetes management guidelines recommend the use of metformin and glucagon-like peptide-1 receptor agonists, especially liraglutide, in adolescents and children with T2DM [31]. The Australasian Pediatric Endocrine Group guidelines suggest exploring newer antidiabetes medicines already approved for managing T2DM in adults in children [32]. Based on the current efficacy and safety data, it is very likely that other SGLT2i in addition to empagliflozin will be approved for managing T2DM in children, apart from the conditional approval for use of SGLT2i in T1DM children with metabolic syndrome. Pleotropic benefits of SGLT2i include a reduction in fatty liver disease, uric acid levels and blood pressure, which are of importance in children with diabetes and metabolic syndrome [33,34]. It must be realized that the benefits of use of SGLT2i in kids would primarily be in T2DM with obesity (diabesity). Caution should be exerted in lean children.
Limitations of our systematic review include the small number of RCTs available for analysis. Hence there remains an urgent need for bigger RCTs with a longer duration of follow-up evaluating all the different types of SGLT2i in children and adolescents with T2DM. To conclude, our systematic review provides us with reassuring data on the safety of use of SGLT2i in children and young adults.