Changes in lifestyle and obesity during the COVID-19 pandemic in Korean adolescents: based on the Korea Youth Risk Behavior Survey 2019 and 2020
Article information

Abstract
Purpose
The coronavirus disease 2019 (COVID-19) pandemic has affected people's daily lives and increased their time spent at home. This study aims to investigate the changes in lifestyle factors and obesity among Korean adolescents before and during the COVID-19 outbreak.
Methods
We used the data of 109,282 adolescents aged 12–18 years, from the Korea Youth Risk Behavior Survey conducted in 2019 and 2020 before and during the COVID-19 pandemic, respectively. The changes in the prevalence of obesity and lifestyle factors (diet, exercise, sitting time, and sleep duration) were assessed. The adjusted odds ratios (ORs) (95% confidence intervals [CIs]) of predictors for obesity were calculated.
Results
The prevalence of overweight (10% to 10.5%) and obesity (11.5% to 12.7%) increased significantly, especially among males younger than 15 years, whereas significant differences were absent among females. The mean body mass index z-score increased from 0.28 to 0.39 in males but decreased from 0.08 to 0.04 in females. Fruit consumption, regular exercise, and average sleep duration decreased, whereas sitting time increased. After controlling for covariates, a short sleep duration (OR, 1.14) and an increased sitting time (OR, 1.14) were significantly associated with an elevated risk for overweight/obesity.
Conclusions
During the COVID-19 pandemic, the prevalence of obesity and overweight increased, particularly in males, as did unfavorable trends in related lifestyle factors. Sex- and age-specific strategies to improve lifestyle factors associated with obesity are needed, especially during the COVID-19 pandemic.
Highlights
· During the COVID-19 pandemic, the prevalence of overweight and obesity increased significantly, particularly among young males. Short sleep duration and increased sitting time were associated with an increased risk of overweight and obesity.
Introduction
It has been nearly 2 years since the emergence of severe acute respiratory syndrome coronavirus 2 in Wuhan, China, in December 2019, and the end of the coronavirus disease 2019 (COVID-19) pandemic is difficult to predict. The unprecedented effects of the COVID-19 pandemic have changed our lifestyles dramatically. The social distancing mandates, including school closures, have specifically impacted the lives of Korean adolescents, given that they spend a large portion of their waking time at school. Several studies before the COVID-19 pandemic revealed increased obesity rates during academic breaks due to decreased physical activity, such as school-organized sports [1,2]. Researchers hypothesized that the structured timetable, with its organized exercise and controlled school meals, aided students in staying fit. Social distancing measures further reduced accessibility to other outdoor activities [3-13], consequently increasing sedentary behavior as time spent at home increased [8,13-15]. People were less likely to go shopping or eat out but were more likely to buy nonperishable processed foods [11,16]. Because of these, studies with limited participants have found that childhood obesity is on the rise during the COVID-19 pandemic [3,7,8,13,17-20]. The results varied depending on ethnicity [17], region [11,21], age [7,13], and sex [8], and studies have not explored nationwide databases or included lifestyle changes. In Korea, schools were fully closed from March–May 2020 and partially closed until June 2021. The duration of school closure (a total of 60 weeks) in Korea was longer than that in China (27 weeks) and the United States (US) (58 weeks) [22]. Only 2 single-center studies found an increase in obesity among Korean adolescents [19,20].
Thus, we carried out this study to identify the effects of the COVID-19 pandemic on lifestyle factors associated with overweight and obesity. We aimed to assess the changes in body mass index (BMI) z-score and obesity prevalence by gender and age, before and during the COVID-19 pandemic, and identify the lifestyle factors that contributed to these changes.
Materials and methods
1. Study population
The data for this study were obtained from the Korea Youth Risk Behavior Survey (KYRBS), which was conducted in 2019 and 2020. The KYRBS is a web-based survey conducted by the Centers for Disease Control and Prevention in South Korea, with a stratified, clustered, and multistage probability sampling design to understand the current status of health behaviors in Korean middle and high school students. Prior to the study, all participants provided informed consent. Since 2015, the Institutional Review Board of the Korean Centers for Disease Control and Prevention has waived the need for the KYRBS ethics approval under the Bioethics & Safety Act, and the survey results have been made available to the public for academic use. The KYRBS 2019 and 2020 were carried out from June 3–12, 2019 and from August 3 to November 13, 2020, respectively. On January 30, 2020, the World Health Organization declared the coronavirus outbreak a Public Health Emergency of International Concern, and on March 11, 2020, they declared it a pandemic. Thus, the survey in 2019 was conducted before the COVID-19 pandemic, and the survey in 2020 was conducted during the COVID-19 pandemic. This study included 109,282 adolescents aged 12–18 years (55,748 in 2019 and 53,534 in 2020) who completed the health examination survey online. In the end, 2,970 questionnaires were excluded because they lacked data on height and weight (1,555 in 2019 and 1,415 in 2020).
2. Demographic and lifestyle factors and definitions
Household economic status was divided into 3 categories (high, middle, and low) according to the participants' subjective answers to a questionnaire. Residential areas were divided into 3 categories: urban (major cities such as Seoul, Busan, Daegu, Incheon, Gwangju, Daejeon, Ulsan, Sejong, and parts of Gyeonggido), suburban (small and medium-sized cities), and rural (small and medium-sized cities).
The KYRBS is a self-reported survey that includes questions about weight and height. The BMI was calculated as weight divided by height squared (kg/m2). The BMI status was determined using the Korean National Growth Charts' sexand age-specific percentiles [23]. The BMI status was categorized as normal (BMI<85th percentile), overweight (BMI≥85th percentile, and <95th percentile), and obese (BMI≥95th percentile).
Questions on lifestyle factors were answered by all participants, such as the frequency of eating fruits or fast food, exercise, and the sitting/sleeping time during the previous 7 days. Fastfood consumption was used to divide participants into 2 groups: those who ate fast food more than once a week and those who did not eat fast-food. Fruit consumption was used to divide participants into 2 categories: those eating fruits more than 3 times per week and those eating fruits less than 3 times per week. Exercise status was used to divide participants into 2 groups: those who undertook moderate to vigorous exercise for more than 60 minutes per day at least once a week and those who did not exercise for more than 60 minutes per day throughout the week.
The mean sitting time and sleep duration were categorized into 4 quartiles. Sleep duration was calculated by subtracting the time of going to bed at night from the time of waking up in the morning.
3. Statistical analysis
IBM SPSS Statistics ver. 25.0 (IBM Co., Armonk, NY, USA) was used for statistical analysis with the multistage clustersampling design. The numerical variables were evaluated using the complex sample descriptive procedure, and categorical or ordinal variables were evaluated using the complex-samples crosstabs procedure to compare study variables before and during the COVID-19 pandemic. Multiple logistic regression analysis was used to estimate adjusted odds ratio (OR) and the 95% confidence interval (CI) of lifestyle factors for overweight or obesity after controlling for covariates. A P-value of <0.05 was considered statistically significant.
Results
There were no significant differences in sex, household income, and residential area before and during the COVID-19 outbreak (Table 1). Overall, the prevalence of overweight and obesity increased from 10% to 10.5% and 11.5% to 12.7%, respectively. The BMI z-score also increased from 0.18 to 0.22.

General characteristics of the study subjects (N=109,282)
Table 2 and Fig. 1 show the differences in mean weight, BMI, BMI z-score, and prevalence of obesity before and during the COVID-19 pandemic. During the pandemic, the prevalence of overweight and obesity increased significantly in males, from 11.0% to 12.1% and 14.4% to 16.3%, respectively. An increase in obesity was more evident in younger male participants and was significant in those younger than 15 years. In contrast, there were no significant differences in the prevalence of overweight and obesity in females except those aged 12 years, who showed an increased obesity prevalence from 8.5% to 8.7%. The average BMI z-score among males increased by 0.11, while that among females decreased by 0.04. The increase in BMI z-score was greater in younger males (by 0.3 in 12-year-olds) than in older males (by 0.01–0.02 in 16–18-year-olds). In females, consistent trends in weight/BMI changes were not observed. The BMI z-score in females increased between the ages of 12 and 13 and decreased between the ages of 14 and 18 during the COVID-19 pandemic.
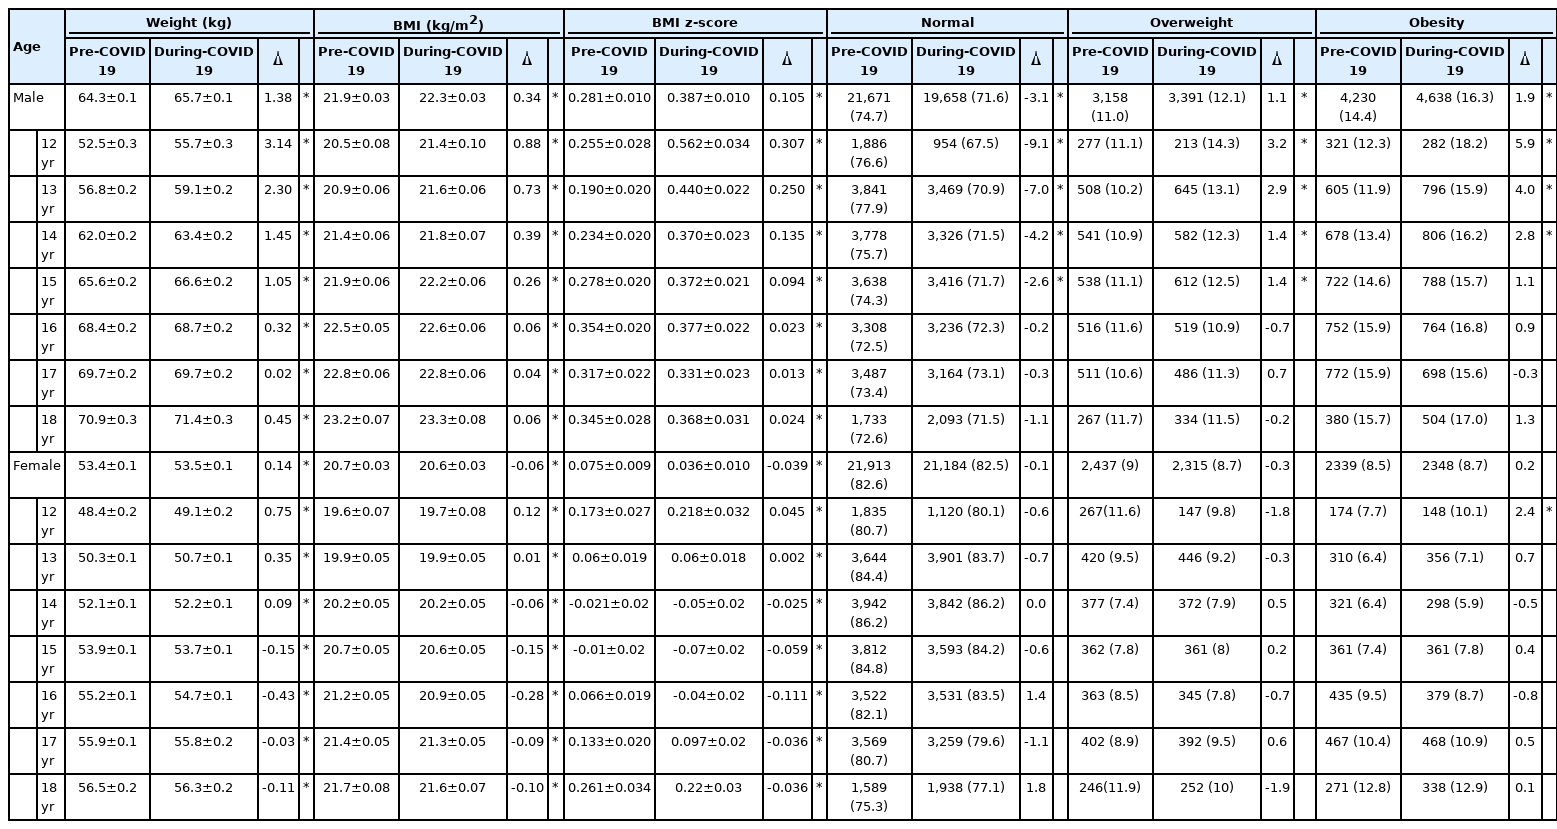
Anthropometric changes and prevalence of overweight, obesity before and during the outbreaks of pandemic COVID-19

Comparison of prevalence of overweight or obesity before and during the COVID-19 pandemic by sex.
***P<0.001.
Fig. 2 presents the comparison of lifestyle factors by sex before and during the COVID-19 pandemic. Fruit consumption was significantly reduced during the COVID-19 pandemic compared to that before the pandemic, but there was no difference in fast-food consumption. The proportion of participants who exercised more than once a week decreased significantly, particularly in males (-5.4% in males and -1.8% in females). In both sexes, mean sleep duration decreased by 0.05 hours. Notably, the mean sitting time increased by 0.14 hours in males, whereas it decreased by 0.1 hours in females.

Comparison of lifestyle behaviors before and during the COVID-19 pandemic by sex.
***P<0.001.
Male participants from low-income households and those residing in rural residential areas primarily reported overweight/obesity (Fig. 3). In lifestyle factors, participants in the lowest sleep duration quartile (<5.9 hours per day) were at increased odds of overweight/obesity compared to those in the highest quartile (>7.9 hours per day) (OR [95% CI], 1.14 [1.08–1.20]). Those who spent more than 6.3 hours a day sitting (highest quartile) showed a 1.14 times higher OR of overweight or obesity than those who spent less than 3.6 hours a day sitting (lowest quartile).
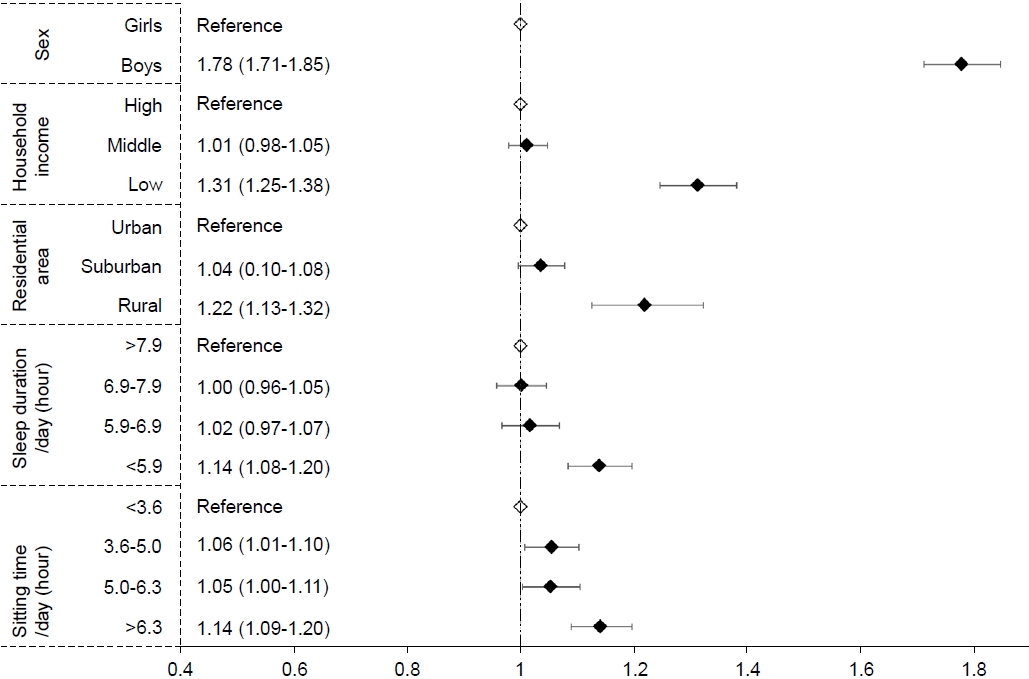
Adjusted odds ratio (95% confidence interval) for overweight/obesity. The analyses were adjusted for age, fruit intake, fast-food intake, and all variables in the figure.
Discussion
In this study, we analyzed the changes in lifestyle factors and obesity in Korean adolescents before and during the COVID-19 outbreak. Our study showed that the prevalence of overweight and obesity increased significantly in males, especially those younger than 15 years, whereas there were no significant differences in females, except for those aged 12 years. Fruit consumption, exercise, and average sleep duration showed a decrease among both sexes, whereas average sitting time increased in males and decreased in females.
In our nationwide representative study among Korean adolescents, the prevalence of overweight (10% to 10.5%) and obesity (11.5% to 12.7%) increased during the COVID-19 pandemic. Several studies have reported an increase in the prevalence of childhood obesity or weight gain during the COVID-19 lockdown [3,7,8,13,17-20]. Among those studies, only 2 were large-scale studies. In a national retrospective survey in China, the prevalence of overweight/obesity (21.3% to 25.1%) and obesity (10.5% to 12.9%) increased in overall youths during the COVID-19 lockdown [13]. A recent cross-sectional study from the US reported an increased prevalence of childhood obesity from 13.7% to 15.4% during the COVID-19 pandemic [18].
We found that adolescents in the younger age group (12–15 years old) showed a significant increase in BMI z-score. Previous studies also showed age-associated differences in obesity risk after the COVID-19 pandemic among affected age groups. In China [13], high school aged adolescents gained more weight than older youth (undergraduate and graduate students). A study of 2–17-year-olds in the US revealed a relatively larger increase in obesity among those in the 5–12-year age group [18]. Additionally, among children 0–14 years old in a German study, obesity increased in the 10–12-year age group [7].
We also discovered that males were more likely to gain weight than females during the COVID-19 pandemic. Several studies have also revealed a sex difference in weight gain [7,8]. In a longitudinal study in Italy, adolescents gained 2.8 kg on average during the lockdown, with males gaining more weight than females [8]. A German study using retrospective interviews also reported that males were more likely to report weight gain than females [7]. We speculated that the increase in obesity during the COVID-19 pandemic is mainly due to a decrease in physical activity, a well-known risk factor for obesity [24]. In this study, physical activity, represented by exercise and sitting time, was higher in males than in females prior to the pandemic. While the amount of exercise decreased among both sexes during the pandemic, sitting time increased for males but decreased for females. An increase in sitting time was more profound in younger males (12–14 years) than older males (data not shown). In our logistic regression model, a sitting time longer than 6.3 hours per day was associated with an increased risk of obesity. Considering all the evidence, adolescents who were physically active (especially younger males) in their daily and school lives seemed to experience a more profound decrease in physical activity during the COVID-19 pandemic, making them more vulnerable to obesity.
Sleep duration decreased by 0.05 hours on average during the COVID-19 pandemic in Korean adolescents. Contrary to our findings, studies in Italy [25], Spain [9], Greece [3,25], and China [13] reported that children slept more during the COVID-19 lockdown. A retrospective study in the US discovered that bedtime was delayed by an average of 1.6 hours during the COVID-19 pandemic [5]. The postponed bedtime during school closure could have resulted in shorter sleep duration in our study population. Short sleep duration is also a risk factor for obesity [26,27], increasing the risk of obesity through increased calorie intake due to increased serum ghrelin and decreased serum leptin and reduced physical activity due to increased fatigue and tiredness [26,27]. In our study, adolescents who slept for less than 5.9 hours had higher odds of developing obesity than adolescents who slept for more than 7.9 hours. Our findings supported our hypothesis that reduced sleep duration during the COVID-19 pandemic contributed to an increase in obesity.
Fruit consumption decreased among both sexes during the COVID-19 pandemic. This could also reflect the effect of school closure on availability of fruits at school meals. However, in our logistic regression model, a decrease in fruit consumption was not associated with an increased risk of obesity. In contrast with our finding, other studies from China [28], Germany [7], and Greece [3] found that fruit consumption increased during the COVID-19 lockdown.
Regarding changes in other lifestyle factors, none were observed in fast-food consumption before and during the COVID-19 pandemic, and fast-food consumption was not associated with obesity in this study. Although low income and rural residence were associated with higher risk of obesity in this study, changes in the prevalence of obesity were absent in the low-income group and those residing in rural areas (data not shown) during the COVID-19 pandemic.
Our study had some limitations. Determining the exact time-to-time relationship between lifestyle factors and weight status was challenging due to the cross-sectional study design. Furthermore, because all data relied on self-assessment rather than actual measurement, anthropometric indices, such as height and weight, may have been inaccurate, and answers may have included recall bias. Nonetheless, this is the first nationally representative study that compared the prevalence of obesity according to sex and age and identified lifestyle factors associated with an increase in obesity before and during the COVID-19 pandemic.
In conclusion, the prevalence of obesity has increased in Korean adolescents during the COVID-19 pandemic, in males aged 12–14 years and from among those aged 12–18 years in age. The prevalence of obesity/overweight in females did not differ significantly before and during the COVID-19 lockdown; however, the BMI z-score decreased by 0.039. Furthermore, both sexes experienced adverse lifestyle changes, such as decreased fruit consumption, physical activity, and sleep duration as well as increased sedentary time. Short sleep duration and prolonged sitting time were positively associated with obesity risk in Korean adolescents. Given the possibility of a prolonged COVID-19 pandemic, health professionals should be aware of and prepare for an increase in obesity prevalence, particularly among males, as well related unfavorable trends in related lifestyle factors. To address deteriorating healthy lifestyle factors, such as decreased sleep duration and physical activity, adolescent public health strategies are required.
Ethical statement
Since 2015, the Institutional Review Board of the Korean Centers for Disease Control and Prevention has waived the need for KYRBS ethics approval under the Bioethics and Safety Act, and the data have been made available to the public for academic use. Prior to the study, all participants provided informed consent. This study was approved by the Inje University Sanggye Paik Hospital's Institutional Review Board (approval number: SGPAIK 2021-08-003).
Notes
Conflicts of interest
No potential conflict of interest relevant to this article was reported.
Funding
This study received no specific grant from any funding agency in the public, commercial, or not-for-profit sectors.
Data availability
The data that support the findings of this study can be provided by the corresponding author upon reasonable request.
Author contribution
Conceptualization: SK, SHK, MJP; Data curation: SK; Formal analysis: SK; Methodology: SK; Project administration: SK, MJP; Visualization: SK, MYS; Writing - original draft: SK; Writing - review & editing: SK, SHK, MJP
Acknowledgements
We gratefully acknowledge the Korea Ministry of Education, Health, and Welfare, as well as the Korea Center for Disease Control and Prevention, for allowing us to use the Korea Youth Risk Behavior Survey data.