Changes in body mass index in boys with central precocious puberty over 2 years of gonadotropin-releasing hormone agonist therapy
Article information
Abstract
Purpose
Gonadotropin-releasing hormone agonist (GnRHa) is a safe and effective therapy used to treat central precocious puberty (CPP). Although most studies have reported no significant difference in body mass index (BMI) in girls during and after GnRHa therapy, few studies have investigated changes in BMI in boys with CPP. This study evaluated the effects of GnRHa therapy on BMI in boys with CPP.
Methods
This study included 75 boys with CPP at Ajou University Hospital between January 1, 2007 and December 31, 2016, who treated with leuprorelin acetate or triptorelin acetate every 4 weeks for at least 2 years. The subjects were divided into 3 groups according to BMI: normal weight, overweight, and obese. We analyzed the BMI standard deviation score (SDS) in each group before therapy and after 1 year and 2 years of therapy.
Results
Of the 75 boys, 37 were in the normal weight group, 21 were in the overweight group, and 17 were in the obese group. Magnetic resonance imaging that was performed before treatment showed abnormal findings in 9 boys. The mean BMI SDS for all participants at initiation was 1.0±0.8, and that in the normal weight, overweight, and obese groups was 0.3±0.4, 1.3±0.1, and 1.9±0.3, respectively. There were no significant differences in BMI SDS in any group after 1 or 2 years of treatment.
Conclusions
The BMI SDS in boys with CPP did not significantly change over 2 years of GnRHa therapy.
Introduction
Central precocious puberty (CPP) is caused by premature activation of the hypothalamic-pituitary-gonadal axis before age 8 in girls and age 9 in boys [1]. The overall incidence and prevalence of CPP in Korea are 122.8 in 100,000 (262.8 in girls and 7.0 in boys) and 193.2 in 100,000 (410.6 in girls and 10.9 in boys), respectively, indicating a higher incidence and prevalence in girls [2]. Gonadotropin-releasing hormone agonist (GnRHa) is a widely used CPP treatment option with established evidence for its safety and efficacy [3]. GnRHa therapy has been reported to effectively and selectively inhibit gonadal sex hormone levels in adolescents with CPP, restoring final adult height [4].
A previous study reported that CPP is associated with obesity [5]. In addition, there are ongoing studies investigating the relationship between GnRHa therapy and obesity. Although only a few previous studies have suggested that GnRHa therapy in girls with CPP either increases [6] or decreases [7] body mass index (BMI), the general conclusion from previous studies is that there is no significant change in BMI during and after GnRHa therapy [5,8-10]. Furthermore, recent studies assessing girls with CPP reported that only girls in the normal weight group had increased BMI after GnRHa therapy; there were no changes in the overweight and obese groups [11-15]. Additionally, only a few studies have assessed the association between GnRHa therapy and change in BMI in boys with CPP [5,16,17]. Therefore, this study was designed to examine BMI changes in boys diagnosed with CPP over 2 years of GnRHa therapy.
Materials and methods
1. Subjects
This study included boys who had been diagnosed with CPP at Ajou University Hospital between January 1, 2007 and December 31, 2016, and who were treated with subcutaneous injections of 3.75 mg of leuprolide acetate or triptorelin acetate every 4 weeks for at least 2 years. Clinical data were collected retrospectively from chart reviews.
CPP was defined as development of pubertal symptoms such as testicular volume ≥4 mL before the age of 9 years, bone age advanced at least 1 year beyond chronological age, and a pubertal response to a GnRH stimulation test (peak luteinizing hormone [LH] response≥5 IU/L) [3]. This study included boys diagnosed with CPP before 10 years of age because of the probability of diagnostic delay [18,19].
The exclusion criteria were as follows: patients who had not yet completed 2 years of treatment, patients who were lost to follow-up within 2 years, patients who received other medical treatments that affect BMI such as steroids, and patients who were undergoing growth hormone treatment.
Participants were divided into 3 groups according to BMI. The normal weight group was defined as BMI≥3rd and <85th percentile, the overweight group was defined as BMI≥85th and <95th percentile, and the obese group was defined as BMI≥95th percentile using the 2007 Korea National Growth Charts [20].
2. Investigation
Data on age, height, weight, BMI, testis volume, and bone age were collected before GnRHa therapy and after 1 and 2 years of therapy from clinical charts and electronic medical records. Height was measured to the nearest 0.1 cm using a Harpenden stadiometer (Holtain Ltd., Crymych, Wales, UK), and weight was measured to the nearest 0.1 kg using a digital scale. BMI was calculated by dividing the weight by the square of height in meters (kg/m2). Bone age was measured by a pediatric endocrinologist using radiographs of the left hand, according to the method of Greulich and Pyle [21]. Testis volume was measured by the same investigator using a Prader orchidometer. Standard deviation scores (SDS) of height, weight, BMI, and bone age were calculated by the Lambda-Mu-Sigma method using the 2007 Korean National Growth Charts [20].
Gonadotropin-releasing hormone (GnRH) stimulation tests were performed to evaluate pubertal response in all subjects. Basal serum samples were collected prior to injection of GnRH (100 μg Relefact; Sanofi-Aventis, Frankfurt am Main, Germany), and poststimulation samples were collected at 30, 45, 60, and 90 minutes after injection to evaluate LH, follicle-stimulating hormone (FSH), and testosterone levels. LH and FSH levels were measured using an immunoradiometric assay (BioSourse, Nivlles, Belgium) with detection limits of 0.1 and 0.2 IU/L, respectively. Testosterone level was measured using a radioimmunoassay (Coat-A-Count, Diagnostic Products, Los Angeles, CA, USA) with a detection limit of 0.01 ng/mL.
Before GnRHa therapy was initiated, all subjects underwent sella magnetic resonance imaging (MRI) using gadolium-enhanced T1- and T2-weighted images in axial, coronal, and sagittal sections.
3. Statistical analysis
One-way analysis of variance or Kruskal-Wallis analysis was used to compare the characteristics of the normal weight, overweight, and obese groups. Independent t-test or Mann-Whitney U-test was used to estimate the differences between boys on leuprolide acetate therapy and those on triptorelin acetate therapy and between the normal MRI group and the abnormal group. Paired t-test or Wilcoxon matched-pairs signed-ranks test were used to analyze the differences of BMI SDS in each group before therapy and after 1 and 2 years of therapy. A P-value <0.05 was considered statistically significant. All statistical analyses were performed using IBM SPSS Statistics ver. 21.0 (IBM Co., Armonk, NY, USA).
Results
1. Baseline characteristics before therapy
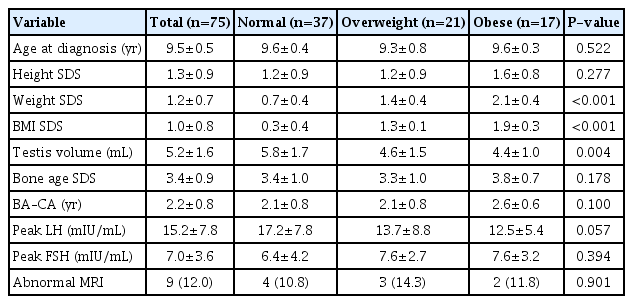
A total of 75 boys participated in this study, of which 37 were in the normal weight group, 21 were in the overweight group, and 17 were in the obese group. The mean age at the time of diagnosis was 9.5±0.5 years, and the mean difference between bone age and chronological age was 2.2±0.8 years. The overall mean testicular volume was 5.2±1.6 mL, while those of the normal weight, overweight, and obese groups were 5.8±1.7 mL, 4.6±1.5 mL, and 4.4±1.0 mL, respectively, indicating a significantly larger mean volume in the normal weight group (P=0.004). There were no significant differences in baseline characteristics among the 3 groups aside from testicular volume. The mean LH and FSH peak values from the GnRH stimulation test were 15.2±7.8 mIU/mL and 7.0±3.6 mIU/mL, respectively, which were not significantly different. There were 9 patients (12.0%) who exhibited abnormal findings on MRI, 4 of whom were in the normal weight group (10.8%), 3 were in the overweight group (14.3%), and 2 were in the obese group (11.8%). There were no significant differences among these groups (Table 1).
2. Changes in BMI SDS after 1 and 2 years of GnRHa therapy
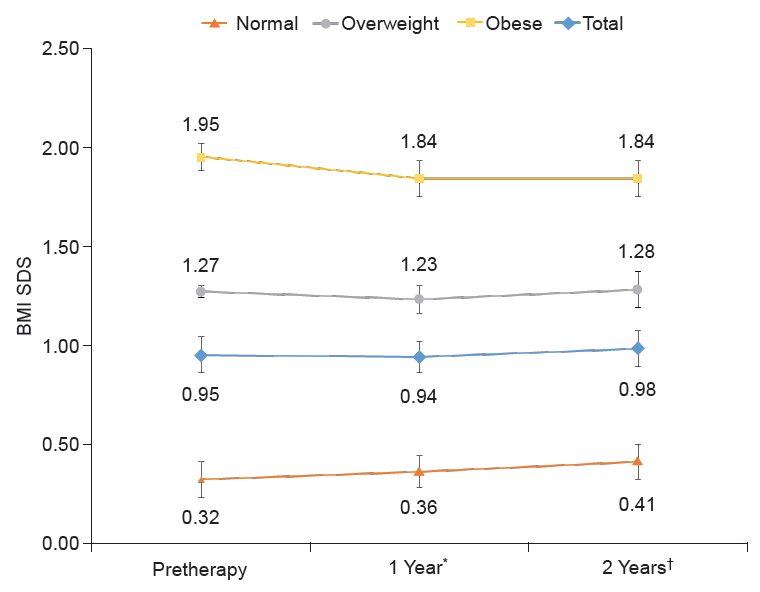
Comparison of BMI SDS in the entire study cohort showed no significant changes from pretherapy values to the values after 1 and 2 years of GnRHa therapy (0.95±0.75 vs. 0.94±0.73, P=0.667; 0.95±0.75 vs. 0.98±0.76, P=0.532). Furthermore, comparison of BMI SDS among weight subgroups showed no significant difference between the pretherapy and posttherapy (1 and 2 years) values (Fig. 1).

Changes in BMI SDS after 2 years of GnRHa therapy in participants with CPP. BMI, body mass index; SDS, standard deviation score; GnRHa, gonadotropin-releasing hormone agonist; CPP, central precocious puberty. Values are presented as mean. *P>0.05 compared with pretherapy values in all groups. †P>0.05 compared with pretherapy values in all groups.
3. Comparison of the leuprolide acetate treatment group and the triptorelin acetate treatment group
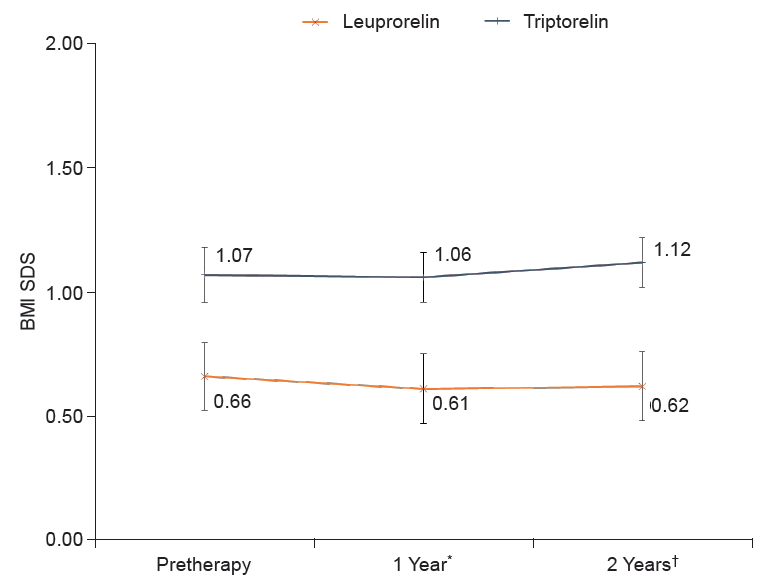
From the entire cohort of 75 patients, 21 received a 4-week treatment of leuprolide acetate, and 54 patients received a 4-week treatment of triptorelin acetate. Pretherapy BMI SDS values in the leuprolide acetate group and the triptorelin acetate group were 0.7±0.6 and 1.1±0.8, respectively, indicating a significantly higher BMI SDS in the triptorelin acetate group (P=0.034). There were no other differences in baseline characteristics between the 2 groups. In comparison to the pretherapy value, there were no significant differences in BMI SDS values at either the 1- or 2-year timepoints after therapy between the 2 groups (Fig. 2).

Changes in BMI SDS between the leuprolide acetate treatment group and the triptorelin acetate treatment group after 2 years of GnRHa therapy in participants with CPP. BMI, body mass index; SDS, standard deviation score; GnRHa, gonadotropin-releasing hormone agonist; CPP, central precocious puberty. Values are presented as mean. *P>0.05 compared with pretherapy values in all groups. †P>0.05 compared with pretherapy values in all groups.
4. Comparison of MRI findings
From the entire cohort, 9 patients exhibited abnormal findings following sella MRI, while the remaining 66 patients showed normal findings. The abnormal findings on MRI were incidental, including 3 Ratheke's cleft cysts, 3 pituitary hyperplasias, 2 suprasellar arachnoid cysts, and 1 pituitary stalk thickening. There were no differences in baseline characteristics between the groups with and without abnormal MRI findings. Moreover, in comparison to the pretherapy value, there were no significant differences between the 2 groups at 1 and 2 years after therapy (Fig. 3).

Changes in BMI SDS between the normal MRI group and the abnormal group after 2 years of GnRHa therapy in participants with CPP. BMI, body mass index; SDS, standard deviation score; MRI, magnetic resonance imaging; GnRHa, gonadotropin-releasing hormone agonist; CPP, central precocious puberty. Values are presented as mean. *P>0.05 compared with pretherapy values in all groups. †P>0.05 compared with pretherapy values in all groups.
Discussion
In this study, a cohort of 75 boys diagnosed with CPP was assessed for changes in BMI SDS over 2 years of GnRHa therapy. In comparison to BMI SDS values prior to GnRHa therapy, there were no significant changes in BMI SDS at 1 or 2 years after therapy. In addition, there were no significant changes in BMI SDS observed at 1 or 2 years after therapy regardless of subgroup based on BMI (normal weight, overweight, or obese groups).
To date, only a few studies have assessed the changes in BMI following GnRHa therapy in boys with CPP, and the studies have only assessed small cohort sizes. Palmert et al. [5] assessed 96 girls and 14 boys and observed a continuous decrease in BMI SDS from initiation to end of therapy. Although the BMI SDS increased after therapy, these changes were not significant. Feuillan et al. [16] evaluated the changes in BMI SDS after GnRHa therapy in 11 boys who had developed CPP due to hypothalamic hamartoma. Similarly, there were no significant changes in BMI SDS after therapy in comparison to the BMI SDS value measured at the end of therapy. Additionally, Censani et al. [17] analyzed 51 girls and 14 boys receiving GnRHa therapy due to CPP, early puberty, and short stature and found an increase in BMI in females but not in males during GnRHa therapy. However, that study included only 3 boys with CPP. Several studies that have assessed girls with CPP have reported that BMI SDS does not change during and after GnRHa therapy [5,8-10]. In agreement with these findings, the outcomes of our study demonstrate no significant changes in BMI SDS from initiation to 2 years after therapy. These findings suggest that GnRHa therapy has no effect on BMI regardless of sex.
Recent studies have reported an increase in BMI only in the normal weight group of girls with CPP following GnRHa therapy [12-15]. Similarly, Wolters et al. [11] evaluated the effect of GnRHa therapy on BMI in a cohort of patients including 3 males and observed an increased BMI only in the normal weight group. However, the reason behind this phenomenon of BMI increase only in the normal weight group is controversial and has not been elucidated. In contrast to the outcomes of previous studies assessing both girls and boys, the normal weight group in our study did not show any significant increase in BMI following GnRHa therapy.
Despite these interesting findings, this study has a few limitations. First, this study included boys diagnosed with CPP before 10 years of age. When diagnosing CPP in boys, it is difficult to determine the exact point at which the volume of the testicles began to increase. Therefore, determination of the age of onset can be difficult in boys when diagnosing CPP. After a parent first discovers the increase in testicular volume, the first consultation with a pediatric endocrinologist often takes 1.5 years [18,19]. Second, the study had a retrospective design without a control group. Third, analyses of body composition using dual-energy x-ray absorptiometry and obesity-related hormonal parameters (i.e., insulin and leptin) were not performed. Consequently, an underlying mechanism to support the outcomes of this study could not be deduced. Finally, the participants' lifestyle factors relating to obesity were not considered, and long-term follow-up of the participants' adult height was not conducted.
In conclusion, this study did not show any significant BMI SDS changes over 2 years of GnRHa therapy in a cohort of boys diagnosed with CPP. In addition, there were no significant changes in BMI SDS over 2 years of GnRHa therapy in each of the normal weight, overweight, and obese subgroups. We recommend that well-controlled, prospective, and long-term studies be performed in the future to assess participants' final adult height and to further enhance our understanding of CPP.
Notes
Ethical statement
The study was approved by the Institutional Review Board of Ajou University Hospital (approval number: AJIRB-MED-MDB-18-556), and an exemption was made for the requirement of informed consent.
Conflicts of interest
No potential conflict of interest relevant to this article was reported.

