Effect of the COVID-19 pandemic lockdown on the physique of school-age children in Japan
Article information
Abstract
Purpose
Schools in Japan were closed nationwide from March to May 2020 because of the coronavirus disease 2019 (COVID-19) pandemic. Many suspect that this school closure affected children’s mental and physical health. We investigated changes in school-age children’s physiques to determine the effects of the COVID-19 lockdown and restrictions on their health.
Methods
Data were extracted from a database of school physical examinations in Osaka elementary and junior high schools for 4 consecutive years from 2018 to 2021. The following characteristics were analyzed: short stature, tall stature, underweight, mild obesity, middle grade obesity, and severe obesity. The paired Student t-test was used to compare school examination data in the prepandemic period (2018–2019), pandemic lockdown (2019–2020), and post-lockdown period (2020–2021).
Results
Obesity rates in elementary school students aged 6–12 years, particularly in boys, were significantly higher during the lockdown than they were in 2019. After the pandemic, the tall stature rate continued to rise, while rates of short stature and underweight decreased in both sexes in 2020. In junior high school students aged 12–15 years, rates of obesity and underweight tended to decrease in 2020. However, these rates rebounded and rose in 2021 when the lockdown was lifted.
Conclusions
During the COVID-19 pandemic lockdown, elementary school students gained weight, while junior high school students lost weight. The lockdown that was implemented during the COVID-19 pandemic had an unfavorable effect on weight gain, particularly in young school-age children.
Highlights
· Elementary school students gained weight during the lockdown that was implemented due to the coronavirus disease 2019 (COVID-19) pandemic in Japan. In contrast, junior high school students lost weight during this time. The COVID-19 pandemic had an unfavorable effect on weight gain, particularly in younger school-age children.
Introduction
The novel coronavirus disease 2019 (COVID-19), which emerged in Wuhan, China at the end of 2019, has changed society worldwide. The number of infected people with COVID-19 in Japan has increased steadily since the country's first case was reported on January 16, 2020. On February 27, 2020, the Prime Minister abruptly requested that schools be closed temporarily. As the infection continued to spread, the first nationwide state of emergency was declared on April 16, 2020. At the time of this announcement, all kindergartens and schools were closed nationwide. Most schools closed the following week (of April 20, 2020). Children were forced to live extraordinary lives instead of their daily routine of going to school. On May 25, 2020, the state of emergency was ended. Schools resumed their regular operations on June 1, 2020. Most schools didn't start the new semesters until the end of May 2020, and even in areas where schools started in June, school attendance was initially low. Online classes were continued because of the ongoing presence of COVID-19. Students finally returned to school after the summer vacation.
Several studies have shown that these restrictions resulted in major changes in children’s lifestyles, such as decreased sports participation, increased media exposure, increased anxiety and fear, and changes in sleep patterns and eating behavior [1-3]. Recently, one group suggested that the COVID-19 pandemic increased the risk of weight gain by restricting children from attending school [4]. Because lifestyle changes are predictors of weight gain and obesity, almost all studies showed a considerable increase in childhood obesity during the COVID-19 pandemic [5,6].
Since 1900, physical measurements have been taken on a regular basis in Japan's public schools [7]. Currently, students are required to have a physical examination at school twice a year. In 2015, the Japanese Society of School Health published the Health Examination Manual for Children (revised edition), and developed a software known as the Children's Health Management Program [8]. This software was distributed on compact discs to elementary, junior high, and high schools across the country. This software program creates growth and obesity curve graphs. Additionally, this software has a screening function that automatically searches for 9 categories of growth abnormalities, such as short stature, tall stature, obesity, and underweight.
Although the COVID-19 pandemic was associated with weight gain in adults [9,10], little is known regarding its effects on children’s physiques in Japan. To assess the pandemic-related changes in the physique of school-age youths, we compared data from school physical examinations performed during the pandemic in 2020 with those performed prior to the pandemic. We hypothesized that factors that negatively affect physique in schoolchildren were exacerbated during the pandemic-related lockdown.
Materials and methods
1. Subjects
Osaka has a population of 2,690,000 people and a land area of 223 km2. There are 115,000 elementary school students and 51,200 junior high school students in Osaka [11]. This survey only included public school students, and not private school students.
Physical examinations for public school children in Osaka were conducted annually between 2018 and 2021. The school physical examinations have previously been described in detail [12]. Students were evaluated for short stature, tall stature, underweight, mild obesity, middle grade obesity, and severe obesity. In total, 143,758 students from 287 public elementary schools aged 6–12 years and 134 students from public junior high schools aged 12–15 years participated in the study. Permission was obtained from the Osaka City Board of Education. In addition, individual school principals consented to having their schools participate in the study.
The schools were closed from March to May 2020. Schools reopened in June 2020 with online classes. Students were able to attend school in person in September 2021 after the summer vacation.
The children's physiques were assessed based on the percentage of overweight (POW) students, which was calculated using the following formula:
POW (%)=100×(measured weight−standard weight)/standard weight.
The standard weight was defined by age- and sex-specific weight-for-height based on data from the 2000 Annual Report of School Health Statistics from the Japanese Ministry of Education, Culture, Sports, Science and Technology. The Japanese standard weight was calculated using an approximated equation derived from the height and weight distributions at each age [13].
2. Definitions of overweight/obesity and underweight
The criteria for overweight/obesity and underweight were a POW of ≥20% (>120% of the standard weight) and a POW of -≤20% (<80% of the standard weight), respectively. The normal range for school-age children was between -20% and 20%. POWs of ≥20% and <30%, ≥30% and <50%, and ≥50% were defined as mild, moderate, and severe obesity, respectively. In Japan, the POW, which is calculated using the modified weight-for-height method, is used to assess childhood obesity in medical institutions and schools. Dobashi [14] reported that tall students were easily defined as being overweight, whereas short students tended to be evaluated as underweight when using body mass index %. The POW method appears to be more appropriate than body mass index % for school-age children.
3. Definitions of short and tall statures
A short stature was defined as a height <2.0 standard deviations (SDs) from the standard height, while tall stature was defined as a height >2.0 SDs from the standard height. When evaluating Japanese children, the values calculated from the body measurement data released by the Ministry of Health, Labour and Welfare and the Ministry of Education, Culture, Sports, Science and Technology of Japan in 2000 were used as the standard values [15]. These values were used because there has been no major change in the height of Japanese children since 2000. The growth curve standard has not been updated since 2000.
4. Statistical analyses
Datasets were analyzed using JMP 6 software (SAS Institute Inc., Cary, NC, USA). A P-value of <0.05 was considered statistically significant. Continuous variables are expressed as means and standard errors of the mean, while categorical variables are expressed as percentages. The paired Student t-test was used to compare prepandemic 2018–2019 school examination data and postpandemic 2019–2020 school examination data.
5. Ethical statement
All study procedures involving human participants were performed in accordance with the ethical standards of the institutional and/or national research committee, as well as the 1964 Declaration of Helsinki, its later amendments and/or comparable ethical standards. This study was approved by the Osaka City Social Welfare Council Review Board.
Results
1. Short stature
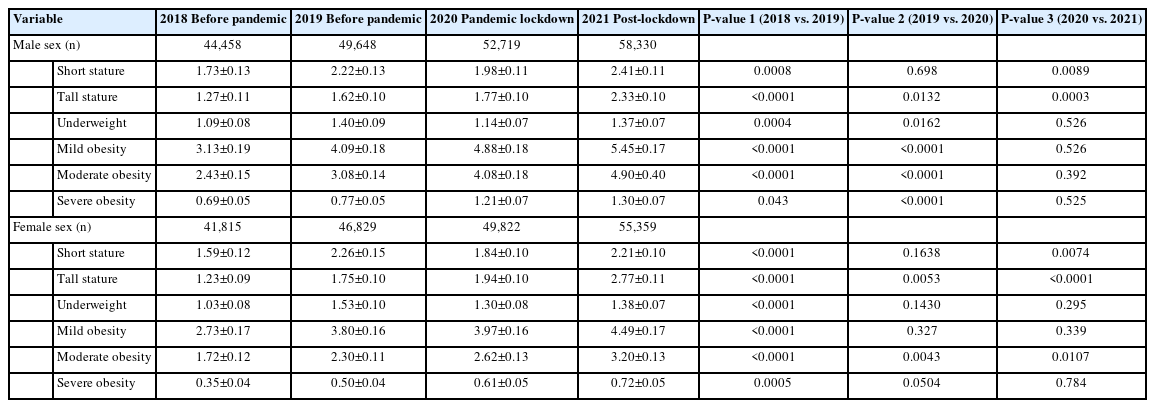
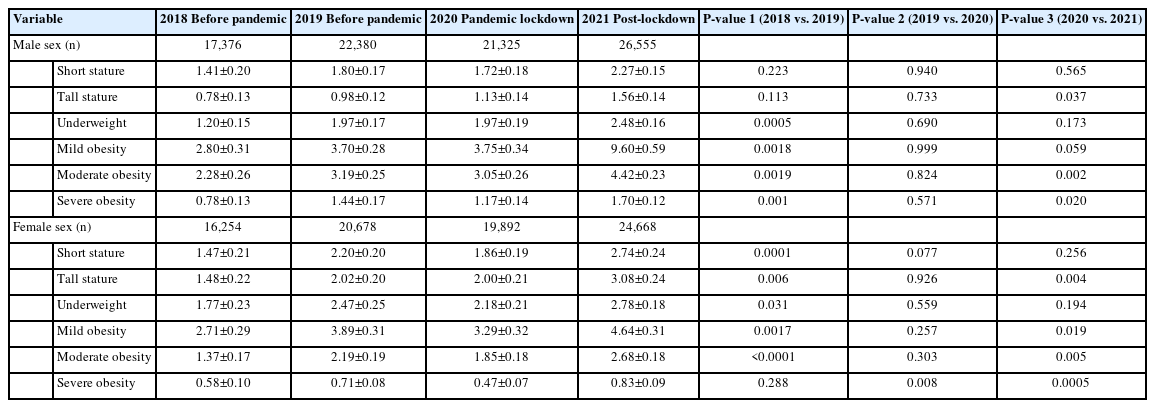
Except for junior high school boys, the rate of short stature significantly increased from 2018 to 2019 before the COVID-19 pandemic (elementary school boys, P=0.0008; elementary school girls, P<0.0001; and junior high school girls, P=0.0001). However, this rate was lower in 2020 when the lockdown was implemented than it was in 2019 in both genders of students in elementary and junior high schools (Tables 1 and 2). In 2021, the short stature rate increased to the same level that it was prior to the pandemic in elementary schools (Fig. 1) and in junior high schools (Fig. 2).

Detection rate of developmental abnormalities of the physique of elementary school students from 2018 to 2021

Detection rate of developmental abnormalities of the physique of junior high school students from 2018 to 2021

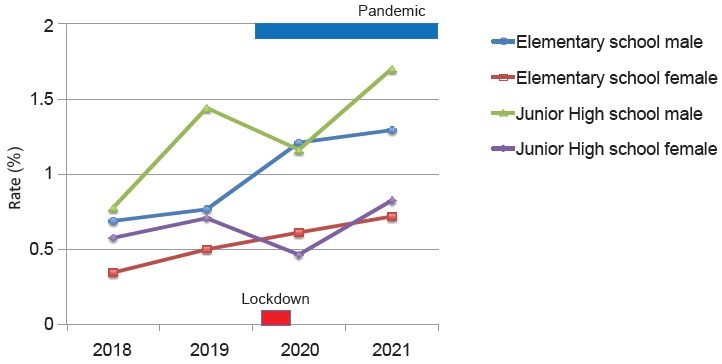
Detection rate of developmental abnormalities in the physique of elementary school students. Data were extracted from school screenings from 2016 to 2021. (A) Elementary school male students. (B) Elementary school female students.
2. Tall stature
The tall stature rate significantly increased from 2018 to 2019 before the pandemic (elementary school boys and girls, both P<0.0001; junior high school girls, P=0.006) in all students except for junior high school boys (Tables 1 and 2). The tall stature rate remained almost unchanged from 2019 to 2020 after the COVID-19 pandemic in junior high schools. However, the tall stature rate in elementary school significantly increased from 2019 to 2021, and from 2020 to 2021 (boys, P=0.0132 and P=0.0003; girls, P=0.0053 and P<0.0001, respectively).
3. Underweight
In elementary school, the rate of underweight was higher in girls than it was in boys, although no significant difference was observed over the 4 years of the study. Among junior high school students, the rate of underweight was higher in girls than it was in boys, and a significant difference was observed in 2018 and 2019 (P=0.0074 and P=0.0122, respectively). The rate of underweight in elementary school students significantly increased from 2018 to 2019, with no sex differences (boys, P=0.0004; and girls, P<0.0001). After the pandemic, the rate of underweight in elementary school boy students significantly decreased by 1.40%–1.14% (P=0.0162) (Table 1) compared to that prior to the pandemic. The rate of underweight in elementary school girls also decreased after the pandemic, but the change was not significant. In junior high school students, the rate of underweight significantly increased from 2018 to 2019 (boys, P=0.0005; and girls, P=0.031), but did not significantly change after this time (Table 2).
4. Obesity
Throughout the 4 years of this study, the obesity rate in elementary schools was higher in boys than it was in girls (Table 1). In 2019, the rates of moderate and severe obesity in junior high schools were higher in boys than they were in girls (Table 2). In contrast, mild obesity was detected more frequently in girls than it was in boys (Table 2). After the pandemic, all forms of obesity were more frequent in elementary school-age boys than they were in girls. In contrast, in 2020, any degree of obesity, particularly severe obesity in girls, decreased compared to that in 2019 in junior high school students (Table 2). In 2021, the obesity rate in junior high school students increased compared to that in 2020 in boys and girls (Figs. 2 and 3).
Discussion
Many studies have reported that the COVID-19 lockdown led to weight gain and exacerbated obesity in adults and children [4-6,9,10]. Long-term lockdowns negatively affect school children’s health and well-being. Children were unable to attend school as a result of the lockdown, and had to forego exercise or other physical activity. Therefore, the lockdown led to obesity in some children. These findings are consistent with the findings of previous studies regarding the effect of summer vacations on weight [16,17].
However, we found that the lockdown due to the COVID-19 pandemic did not promote obesity, but rather improved obesity in Japanese junior high school students aged 12–14 years. In contrast, severe obesity significantly increased in elementary school boys during the lockdown. Although the rate of obesity significantly increased from 2018 to 2019 in boys and girls, it did so at a slower rate than it had before the pandemic [12]. The COVID-19 lockdown increased the proportion of overweight and obesity in elementary school children, presumably because they became less physically active, and spent more time using screen-based media and snacking than they had prior to the pandemic [18,19]. This deterioration is most noticeable in elementary school children with a high degree of obesity.
In this study, the lockdown had little effect on adolescents’ weight gain, although this finding is limited to Japan. The rate of underweight declined, and almost all children appeared to maintain a healthy weight even during the pandemic. The short stature rate decreased from 2019 to 2020, whereas the tall stature rate increased. These findings indicate that the children's physique improved despite the pandemic. The only other report of weight loss due to the pandemic effect is that of older people, which suggested malnutrition and sarcopenia [20].
Obesity among boys and girls has increased in Japan since 1977, but has been declining since approximately 2003 [21-23]. However, in Osaka City, schools have increasingly used growth and obesity curves and detected physical abnormalities on a yearly basis [12]. The adoption of this growth curve software has increased the detection rate of physical developmental abnormalities. The detection rate of physical abnormalities has leveled off because all elementary and junior high schools have recently adopted this software. The annual rate of children with obesity has increased by 20%–30% up to 2019 [12]. However, the rate of increase from 2019 to 2020 reduced to ≤20%, except for a 40% increase in elementary school boys. The increased proportion of overweight and obese children reflects ongoing changes in body composition during the lockdown. Therefore, the rate of increase in obesity among Japanese elementary school students may be due to a fundamental cause, rather than an effect of the COVID lockdown.
Although the weight of elementary school students continues to rise, several factors may explain weight loss among junior high school students. Young children were more affected by the confinement of the lockdown than were older children. During the COVID-19 lockdown, Hourani et al. reported weight gain of 2.3 kg in children aged 6–12 years versus 1.7 kg in children aged 13–17 years [24].
Mulugeta et al. [25] reported a higher net increase in the body mass index of children younger than 12 years than in those over 12 years old. In the Philadelphia region, children aged 5–9 years were more obese than were teenagers [26]. This disparity between ages may be partially explained by the higher daily physical activity and energy needs in younger children compared to those of older children. In elementary school children, particularly boys, obesity worsened during the lockdown because of reduced physical activity and increased sedentary hours [27]. We hypothesize that this disparity is due to the fact that the majority of junior high school students, especially boys, are in puberty. It is speculated that the degree of obesity did not increase in junior high school students because growth in height exceeded that in weight. Obesity in elementary school students has long been recognized, but it does not appear to have been addressed. During the lockdown, many elementary school students may have been tempted to consume junk food, whereas junior high school students who followed a proper diet during the pandemic greatly reduced their weight.
In this study, the rate of short stature significantly increased from 2018 to 2019, but decreased after this time in elementary and junior high school children (including boys and girls). This finding may be explained by the increased use of the growth curve software prior to the pandemic. This abrupt change from an increase to a decrease underscores the magnitude of the COVID-19 pandemic's impact. The rate of a short stature might also have decreased because students slept longer and were better nourished during the lockdown than they were prior. Further research is required to explore these possibilities.
Rates of underweight in elementary and junior high school children significantly increased from 2018 to 2019 before the COVID-19 pandemic, but have remained stable since that time. The rate of underweight in school-age children declined significantly in elementary school children only.
There are some limitations to this study. First, the data were extracted on the basis of physical measurements that were taken at school; therefore, we could not determine each student's life patterns. Second, we performed a statistical comparison of the yearly data collected by each school, but did not perform individual data comparisons. Finally, this was a survey that was conducted until 2021; therefore, further follow-up will be useful once the lockdown is fully released.
In conclusion, elementary school students gained weight during the lockdown that was implemented because of the COVID-19 pandemic in Japan. In contrast, junior high school students lost weight during the lockdown. The COVID-19 pandemic had an unfavorable effect on weight gain, particularly in younger school-age children.
Notes
Conflicts of interest
No potential conflict of interest relevant to this article was reported.
Funding
This work was supported by a Grant-in-Aid for Scientific Research (C) from the Japanese Society for the Promotion of Science (No. 21K11662).
Data availability
The data that support the findings of this study can be provided by the corresponding author upon reasonable request.
Author contribution
Conceptualization: JT, HH, RT, HS, JT, TH, HM, YT; Formal analysis: Funding acquisition: JT; TH, YT; Project administration: JT, RT, JT, MN; Visualization: HS, HH; Writing - original draft: JT; Writing - review & editing: JT, HH
Acknowledgements
The authors would like to thank the participants and the staff of the Osaka City Social Welfare Council and Child Welfare Committee for their helpful contributions. We thank Ellen Knapp, PhD, from Edanz (https:// jp.edanz.com/ac) for editing a draft of this manuscript.


