


Highlights
┬Ę Children who exhibited short stature at the age of 3 continue to display statistically significant smaller stature, lower body weight, and a lower BMI up to the age of 6 compared to children who did not exhibit short stature at age 3.
Introduction
It is important for pediatricians to evaluate the growth status of children because short stature and growth faltering have significant socioeconomic costs; thus this field is of high interest [1-3]. Short stature is defined as a height more than 2 standard deviations below the standard scores or less than the 3rd percentile in the average distribution of heights for children of the same race, sex, and age group [4]. In this study, failure to thrive, including lower weight and body mass index (BMI) than in the general population, will be called growth faltering, which is a descriptive term to diagnose children whose weight for length or BMI is below expectations on age- and sex-specific growth charts or whose weight on those charts has moved down by more than 2 major percentile lines since a previous measurement [5-8].
The causes of short stature and growth faltering can be genetic, birth-related factors, systemic diseases, neurodevelopmental disorders, and environmental factors such as nutritional status, socioeconomic status, and physical activity [9-13]. The differential diagnosis for those causes, timely evaluation of growth problems, determination of appropriate treatment, and proper education for caregivers not only help achieve better growth and developmental outcomes but also have a psychologically positive effect [14-18].
The length, body weight, and head circumference of healthy infants can exceed the percentiles for their genetic target range in the first year of life and still be near the standard interval when they are 3 years old [19]. Additionally, 81% infants born with extremely low birth weights achieve catch-up growth in height before they are 3 years old [20]. Among infants born small for their gestational age, 85%ŌĆō90% show a growth rate exceeding the normal range after birth and achieve a normal growth distribution by the age of 2ŌĆō4 years [21-23]. Many previous studies have revealed that the risk for short stature and developmental disorders increases according to failure to achieve appropriate catch-up growth in children with prematurity, intrauterine growth restriction, and small for gestational age [24-27]. Those studies have also shown that prematurity or low birth weight is a risk factor for short stature and growth faltering, and it is thus necessary to check whether a child's growth is catching up, including long-term follow-up of growth status. However, in Korea, no recent study has analyzed the long-term growth patterns of children drawn from the general population regardless of birth history whose stature at 3 years old, when catch-up growth inhibition based on birth history is completed, was short.
The Korean Disease Control and Prevention Agency provides a growth chart of percentile curves showing the distribution of height, weight, and BMI for Korean children and adolescents; the latest version was published and distributed in 2017. [28]. Since 2007, the National Health Insurance Service (NHIS) has conducted 7 screenings for each child in Korea from 14 days to 71 months of age through the National Health Screening Program for Infants and Children (NHSPIC) to track the growth and developmental status of infants and children, provide timely professional evaluations and interventions, and provide proper education to caregivers.
This nationwide, population-based, retrospective study used NHSPIC data for 6 years after birth to investigate the difference in growth parameters (height, weight, and BMI) between the short stature at 3 years group and the control group of children with nonshort stature at 3 years.
Materials and methods
1. Data source
This study analyzed data from the customized data service of the NHIS in Korea. The NHIS manages the qualifications of health insurance subscribers and their dependents, performs health check-ups, imposes and collects insurance premiums, pays expenses, and implements various programs for health care institutions. The NHIS provides information by linking requested data through a customized data service. For this study, we requested the qualifications, medical treatment data, and NHSPIC data for children born in 2011ŌĆō2014 and followed to 2020.
2. Study population and patient selection
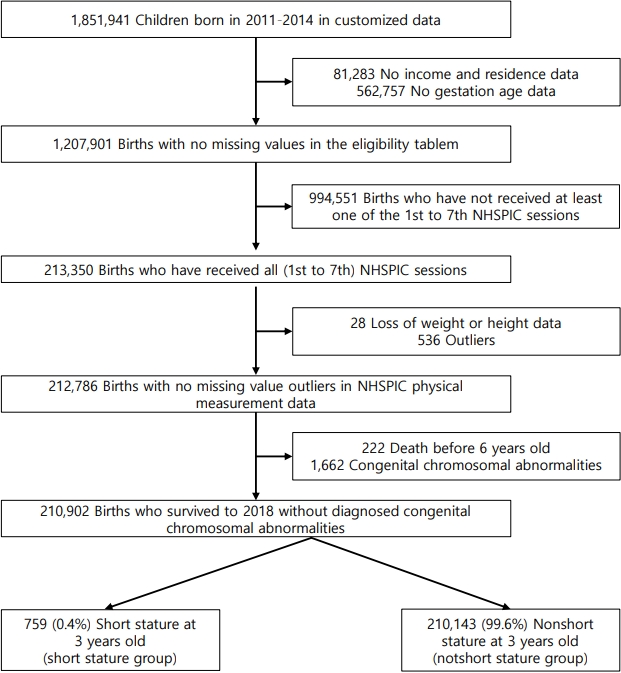
Among 1,851,941 children born in Korea between 2011 and 2014, we excluded those with missing income and residence data (n=81,283), missing gestational age data (n=562,757), nonexamination at one or more of the 7 NHSPIC sessions (n=994,551), absence of weight or height information in the NHSPIC physical measurement data (n=28), outliers in NHSPIC physical measurement data (n=536), death before age 6 years (n=222), or congenital chromosomal abnormalities (n=1,662). Detailed codes are provided in Supplementary Table 1. Therefore, we analyzed 210,902 participants. Among them, those whose height was <3rd percentile at the 4th examination date in the NHSPIC data were defined as the short stature at 3 years group (n=759, 0.4%, the short stature group), and those whose weight was Ōēź3rd percentile at the 4th examination date were defined as the nonshort stature at 3 years group (n=210,143, 99.6%, the nonshort stature group) (Fig. 1).
The physical measurement data (height, weight, and BMI) measured during the 1st (4ŌĆō6 weeks after birth) to 7th (66ŌĆō71 months after birth) NHSPIC sessions were collected for both groups and analyzed by sex.
3. Statistical analysis
Chi-square testing was performed to confirm the frequency and distribution of height in each group. Student t-testing, analyses of variance, and linear regressions were performed to confirm the growth patterns. A P-value of <0.05 was considered to be statistically significant. All analyses were performed using SAS 9.4 (SAS Institute Inc., Cary, NC, USA).
Results
Height, weight, and BMI data for 6 years were extracted from the NHSPIC data for the short and nonshort stature groups and divided by sex. In the short group and the nonshort group, 402 (53%) and 106,963 (51%) of the participants, respectively, were males.
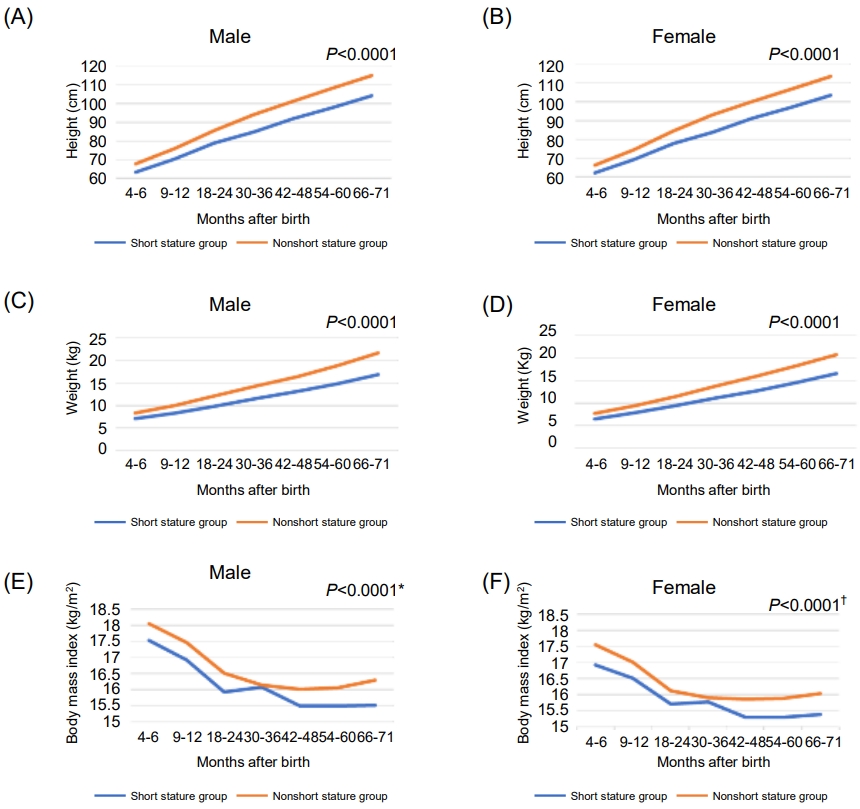
In both sexes, the height for 6 years after birth was significantly smaller in the short stature group than in the nonshort stature group (P<0.0001) (Table 1). The height measurement data for 6 years, before and after 3 years of age, and the mean height of the short stature group did not exceed the mean height of the nonshort stature group in either sex (Fig. 2A, B).
Children in the short stature group had significantly lower weight for 6 years after birth than those of the same sex in the nonshort stature group (P<0.0001), and the mean weight of the short stature group did not exceed that of the nonshort stature group before or after the age of 3 years (Table 2; Fig. 2C, D).
For BMI, both before and after the age of 3 years, the BMI of the short stature group was significantly lower than that of the nonshort stature group (P<0.0001) (Table 3). Although the difference between the two groups was not significant at age 3 years in males (P=0.35), the difference between the groups was significant at age 3 years (P=0.04) in females. In both sexes, the BMI rebounded later in the short stature group than in the nonshort stature group, with the rebound not clearly observed in the short stature group until 6 years of age (Fig. 2E, F).
Discussion
We analyzed nationwide population-based growth parameter data (height, weight, and BMI) from the NHSPIC for children born from 2011 to 2014 and followed to 2020.
Kim et al. [29] found that approximately 90% of children born in 2008 and 2009 participated in one or more of the 7 NHSPIC sessions, with the highest participation rate (54%) in the 4th session, and approximately 12% of all children participated in all the sessions. In our study, we enrolled 210,902 participants who participated in all sessions from customized data for all 1,851,941 children born in 2011ŌĆō2014. Our 11.4% total participation rate is consistent with the previous study.
The height and weight of the short stature group were significantly less than in the nonshort stature group for 6 years after birth in both sexes. BMI was also significantly lower in the short stature group than the nonshort stature group for 6 years after birth in both sexes, except for males aged 30ŌĆō36 months. The BMI rebound in the short stature group was later than in the nonshort stature group, and it was not clearly observed until 6 years of age in the short stature g Fig. 1. Subject selection flowchart. NHSPIC, National Health Screening Program roup in both sexes. This finding indicates that short stature at 3 years of age is associated with smaller height, lower weight, and lower BMI during the first 6 years after birth. Therefore, short stature at 3 years of age can be a warning sign of short stature and growth faltering for up to 6 years of age. Because short stature and growth faltering in early childhood can affect development into adolescence without appropriate treatment [2,9,30], careful monitoring is necessary for children with short stature at age 3 years.
Several recent studies have suggested that premature infants, those with intrauterine growth restriction, and those who are small for their gestational age who have failed to achieve catchup growth by 2ŌĆō3 years of age should be referred to a pediatric endocrinologist [23-26]. However, no recent previous populationbased study reported on the risk of short stature and growth faltering in 3-year-old children with short stature. Our study demonstrates that not only premature children, those with intrauterine growth restriction, and those small for their gestational age but any child with short stature at 3 years of age, regardless of their birth history, should be referred to a pediatric endocrinologist.
Williams and Goulding [31] found that the mean z-scores for height, weight, and BMI decreased between the age of 3 years and adolescence in the late-adiposity rebound group, and those differences were maintained until adulthood for BMI and weight. However, Moon [32] recently found that the probability of reversing obesity was higher in both sexes in the late-adiposity rebound group. This suggests that short stature in 3-yearold children is associated with late-adiposity rebound, which could be associated with persistent growth faltering, and it paradoxically suggests that careful follow-up for obesity is also required for these children.
Because the short stature group consistently showed shorter stature, lower weight, and lower BMI for 6 years after birth than the nonshort stature group, at even the first NHSPIC session, we cannot rule out the possibility that shorter stature at 4ŌĆō6 months is also associated with short stature and growth faltering during the first 6 years of life. Further analysis on growth parameter follow-up in children with short stature at 4ŌĆō6 months of age is required to analyze that possibility.
Short stature at 3 years old is partly due to organic or functional problems since birth; however, failure to provide adequate nutrition to fuel growth also has a significant effect. Therefore, it is necessary and important to intervene in parenting styles and nutritional supply to promote healthy growth. Currently, general education about nutrition is provided through NHSPIC; however, it is implemented based on the normal population. Additional education from pediatricians for 3-year-old children with short stature is needed during further NHSPIC sessions. Screening tests for growth disorders should be started early to enable early detection and treatment, improve growth outcomes, and reduce the burden of medical expenses in the long term.
The prevalence of obesity among children and adolescents is rapidly increasing worldwide, and Korea is no exception [33]. Since Popkin et al. [34] analyzed the double burden of malnutrition, defined as a concurrence of undernutrition and obesity in low and middle-income countries, it would also be meaningful to analyze the relationship between low- and middle-income people in Korea and 3-year-old children with short stature; further discussion about strengthening the social and economic welfare system is essential.
The strength of our study is that, to the best of our knowledge, it is the largest nationwide population-based study to analyze growth parameter outcomes in 3-year-old children with short stature regardless of birth history.
One limitation of our study is that we could not compare children of the same monthly age because NHSPI has a participation age range of 6 months at the 4th session, which made it difficult to accurately define children's ages at 3 years. In addition, participation age for each NHSPI session differs by up to 11 months, which made it difficult to accurately compare the short and nonshort stature groups at the same monthly age. Because NHSPI offers only 7 sessions up to the age of 6 years, it is difficult to say that we had growth information at sufficiently detailed intervals. Information about gestational age, birth length, birth weight, and birth head circumference are not mandatory in the NHSPI data, and if the doctor does not enter the diagnosis code about birth history at the time of a session, it is difficult to obtain that information. Although we excluded children with congenital chromosomal abnormalities, other contributing factors, such as systemic disease and neurodevelopmental disease, were not excluded. As mentioned above, previous studies found that most catch-up growth occurs before about age 3 years, so the standard age for short stature was taken as 3 years in this paper. However, at least one study has shown that catch-up growth also occurs after age 3, so the evidence that 3 years is the age at which catch-up growth according to birth history is completed is insufficient.
Children with short stature at age 3 years require careful growth observation from pediatricians to enable early intervention. Future studies should be designed with more segmented age-specific data to analyze growth data for Korean children with better accuracy. To evaluate the association between undernutrition and economic status in Korea, studies are needed about not only growth status, but also child development and the distribution of appropriate diet and parenting methods through NHSPI to educate caregivers of children with short stature or low socioeconomic analysis.