


Highlights
· Pubertal progression seems to be slower in overweight (OW) girls than in nonoverweight girls presenting with precocious breast development. However, it can progress rapidly in OW girls with particularly pronounced bone age advancement and high luteinizing hormone levels at the initial workup.
Introduction
With the increasing prevalence of childhood obesity, studies have shown that overweight (OW) girls tend to have earlier pubertal timing than normal-weight girls [1-3]. A study performed in Egyptian children compared girls with body mass index (BMI) ≥ 85th percentile and < 85th percentile in terms of their mean age at breast development. Puberty started earlier in girls with BMI ≥ 85th percentile, and excess weight was related to earlier breast development [4]. A prospective cohort study from the United States reported that girls with greater BMI reached breast stage 2 at younger ages than those with lower BMI and confirmed a trend of thelarche onset at younger ages, which is consistent with temporal changes in BMI [5]. A crosssectional study from Brazil also showed that increased BMI was associated with earlier self-assessed pubertal onset [6].
However, a meta-analysis reported no difference in the age at menarche between obese and nonobese girls [7], which suggests that the progression of puberty is slower in obese girls. Furthermore, the precise mechanisms and associated factors contributing to the progression of precocious puberty in OW or obese girls remain to be elucidated. In this study, we aimed (1) to determine whether the progression of puberty is slow in OW girls with precocious breast development, (2) to compare the characteristics of OW vs. nonoverweight (NW) girls with precocious breast development, (3) to discover the characteristics of OW girls with slow pubertal progression, and (4) to define the predictors of rapid pubertal progression in girls with precocious breast development.
Materials and methods
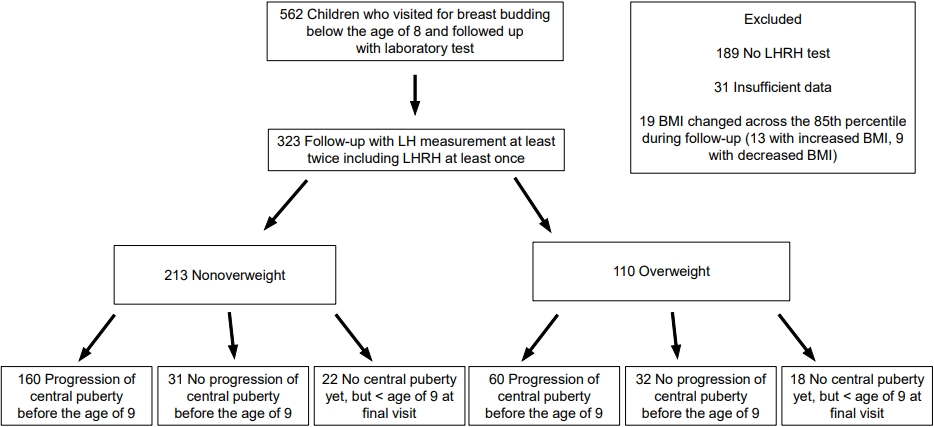
This retrospective cohort study enrolled 562 girls who visited Bundang CHA Hospital for breast budding before 8 years of age, were followed up, and underwent laboratory tests, including luteinizing hormone (LH) measurements, between January 2016 and April 2020. We excluded those without an LH releasing hormone (LHRH) test (n=189) and those without sufficient data (n=31). We also excluded 19 girls (13 with increased BMI and 6 with decreased BMI) whose BMI percentile changed across the 85th percentile during follow-up because they were not considered suitable for the comparison between NW and OW girls. In that way, 323 girls who underwent blood tests at least twice, including the LHRH test at least once, were enrolled, and their medical records were reviewed (Fig. 1).
The OW group was defined as girls with a BMI≥85th percentile, and the NW group was defined as girls with a BMI < 85th percentile for age and sex, based on the 2017 Korean Children and Adolescent National Growth Charts [8]. For the subgroup analysis, the OW group was divided into those with progression of central puberty before 9 years of age (OW-RP subgroup) and those without (OW-SP subgroup).
Clinical and anthropometric data were reviewed: chronological age (CA), bone age (BA), bone age advancement (BA-CA), height, weight, and BMI. Laboratory results were also reviewed: LH, follicle-stimulating hormone (FSH), estradiol (E2), and dehydroepiandrosterone sulfate (DHEA-S) levels.
Height (cm) and weight (kg) were measured to the nearest 0.1 cm and 0.1 kg using a wall-mounted stadiometer (Harpenden Portable Stadiometer, Seritex, Howell, NJ, USA) and a digital floor scale (HE-24, CAS, Yangju, Korea), respectively. Pubertal development was assessed using Tanner staging [9], and BA was evaluated using the Greulich and Pyle atlas.
Serum LH and FSH levels (Atellica, Simens, Germany) and serum E2 and DHEA-S levels (Roche Cobas 8000 e801, Roche Diagnostics, Mannheim, Germany) were measured using electrochemiluminescence immunoassays. Analytical sensitivity was 0.07 U/L for LH, 0.3 U/L for FSH, 5.0 pg/mL for E2, and 0.1 μg/dL for DHEA-S.
The LHRH test was performed when clinical suspicion of rapid pubertal progression was present before the age of 9; however, it was also performed in 12 girls who were 9 years or older when their doctors had a strong suspicion of rapid pubertal progression and the girls were experiencing psychosocial stress from anxiety about the probability of early menarche. For the LHRH test, LH and FSH levels were measured at baseline and at 30, 45, 60, and 90 minutes after an IV administration of gonadotropin releasing hormone 0.1 mg [10]. In the remaining 18 children, pubertal progression was confirmed by basal LH levels. Among girls with progression to central puberty after the age of 9, the CA at confirmation of central puberty was 9.4±0.2 years in the NW group (n=18) and 9.7±0.3 years in the OW group (n=12) (P=0.008).
Progression to central puberty was defined as an LH peak of ≥5 U/L in the LHRH test (n=170 in NW group and n=61 in OW group) [11-13] or a basal LH level of ≥0.3 U/L (n=8 in NW group and n=11 in OW group) in girls with progressive breast development [14-17].
Of the 323 girls, 123 (57.7%) in the NW group and 72 (65.5%) in the OW group (P=0.180) underwent a laboratory workup using basal blood samples drawn before 10:00 AM.
Data are presented as the mean±standard deviation. Statistical analyses were performed using IBM SPSS Statistics ver. 26.0 (IBM Co., Armonk, NY, USA). Student t-test was used to compare the following variables between groups: age, BA, BA-CA, height, weight, BMI, and hormone levels. A logistic regression analysis was used to identify the predictors of rapid pubertal progression. To compare the progression rate to central puberty before 9 years of age between the groups, the chi-squared test and a Kaplan-Meier curve analysis were used. Statistical significance was set at P<0.05.
This study was conducted in compliance with the principles of the Declaration of Helsinki and was approved by the Institutional Review Board of CHA Bundang Medical Center (2021-11-004).
Results
Among the NW group (n=213), progression to central puberty was confirmed before 9 years of age in 160 girls and after 9 years of age in 18 girls. Thirty-five NW girls, including 22 girls younger than 9 years of age at their last visit, did not enter central puberty during follow-up. In the OW group (n=110), 60 girls entered central puberty before age 9, and 12 girls entered it after age 9. Thirty-eight OW girls, including 18 girls younger than 9 years of age at their last visit, did not enter central puberty during follow-up (Fig. 1).
Among those who had been followed until age 9 or older, 83.8% (160 of 191) of NW girls and 65.2% (60 of 92) of OW girls showed central puberty progression before 9 years of age, suggesting that progression to central puberty before 9 years of age was more common in the NW group (P<0.001). The duration of follow-up, counted from the initial visit to confirmation of central puberty progression or the last visit, was longer in OW group (20.4±15.1 and 15.6±11.2 months in OW and NW girls, respectively, P=0.007).
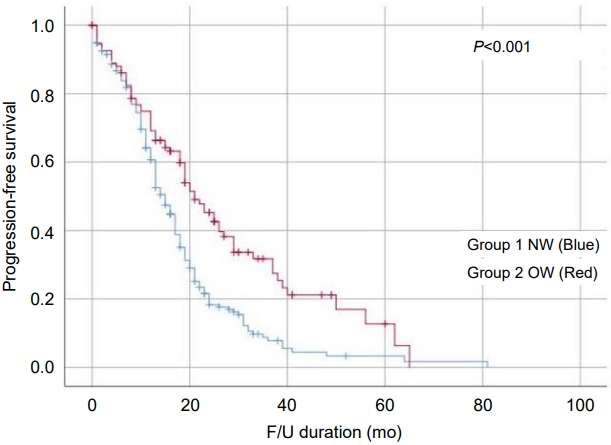
The Kaplan-Meier curve also showed slower progression to central puberty in the OW group than the NW group. Progression-free survival rates, defined as the rate without progression to central puberty among those who were followed up for 1 year (OW: 69.2% vs. NW: 60.6%), 2 years (OW: 45.3% vs. NW: 18.3%) and 3 years (OW: 31.7% vs. NW: 7.8%), were higher in the OW group than the NW group (P<0.001) (Fig. 2).
Age at the initial visit was younger (OW: 6.9±0.8 years vs. NW: 7.2±0.8 years, P=0.009) and BA advancement was more pronounced (OW: 16.7±8.1 months vs. NW: 12.7±7.5 months, P<0.001) in the OW girls than the NW girls. The initial FSH levels were significantly lower in the OW group (2.62±1.7 U/L) than the NW group (3.10±1.8 U/L, P=0.024), but the initial LH levels did not differ significantly between the groups (Table 1).
When progression to central puberty was first confirmed, CA did not differ between the groups, but the OW girls were taller (height standard deviation score: 1.2±0.9 and 0.7±1.0 in OW and NW girls, respectively, P=0.001), and their BA was older (OW: 10.0±1.1 years vs. NW: 9.7±0.8 years, P=0.042) and more advanced (20.6±8.1 and 15.3±7.7 in OW and NW girls, respectively, P<0.001) than NW girls. On the other hand, ΔBA, ΔBA-CA, plasma gonadotropin, and estradiol levels did not differ statistically between the groups, although the DHEA-S level was significantly higher in the OW group than the NW group (85.0±39.3 μg/dL vs. 62.7±30.8 μg/dL in OW and NW girls, respectively, P=0.011) (Table 1).
In the subgroup analysis of OW girls, the OW-RP subgroup had more advanced BA at the first visit (OW-RP: 17.7±7.3 vs. OW-SP: 14.4±7.8, P=0.047) and higher initial LH (OW-RP: 0.26±0.7 vs. OW-SP: 0.02±0.1 U/L, P=0.010), FSH (OW-RP: 3.17±1.7 vs. OW-SP: 1.84±1.3 U/L, P<0.001), and E2 (OW-RP: 11.3±12.2 vs. OW-SP: 4.5±6.4 pg/mL, P=0.001) levels than the OW-SP subgroup. When progression to central puberty was first confirmed, the BA was significantly older in the OW-SP subgroup (OW-SP: 11.2±0.9 vs. OW-RP: 9.8±1.0 years, P<0.001). Although ΔCA was much longer in the OW-SP subgroup, BA-CA and ΔBA-CA did not differ significantly between the subgroups (Table 2).
A logistic regression analysis was performed to identify the predictors for rapid pubertal progression, and it showed that being OW was unlikely to be related to the risk of pubertal progression before 9 years of age (OR [95% confidence interval {CI}], 0.313 [0.157–0.624]; P=0.001). Initial BA advancement (OR [95% CI], 1.056 [1.007–1.107]; P=0.023) and higher FSH (OR [95% CI], 1.432 [1.125–1.822]; P=0.003) and E2 levels (OR [95% CI], 1.062 [1.015–1.112]; P=0.009) were the risk factors for the progression of central puberty before age 9 (Table 3).
Discussion
It has been reported that OW children experience earlier onset of thelarche than those with normal weight, and high leptin levels in OW children might play an important role in gonadotropin secretion and earlier pubertal onset [7,11,18]. Although our study did not examine the prevalence of precocious breast development in these children, 34% of our study cohort was OW, which seems to be higher than the prevalence of OW/obesity in Korean girls [19,20], and they were significantly younger than the children in the NW group. OW girls showed more advanced BA at presentation; however, progression to central puberty occurred at similar ages between the groups, suggesting that pubertal progression might be slower in OW girls.
Many studies have reported a relationship between obesity and an earlier age of pubertal onset, and some have reported earlier age of menarche in obese girls [21,22]. However, a recent meta-analysis reported finding no difference in the age of menarche between girls who were obese and those who were normal weight [7]. In our study, OW girls were less likely than NW girls to progress to central puberty before 9 years of age, supporting that pubertal progression might be slower and the age of menarche be similar or only slightly younger in OW girls than in NW girls.
The BA advancement in OW girls could be due to increased estrogen production [23] and increased aromatization of androgens into estrogen in adipose tissue. Additionally, hyperinsulinemia and high leptin levels can contribute to bone maturation in obese children. Hyperinsulinemia stimulates growth by acting on the insulin-like growth factor-1 receptor, and leptin acts as a skeletal growth factor [1]. The OW group in this study had more advanced BA at their initial workup and at their progression to central puberty than the NW group. That could lead to compromised pubertal height gain in OW children, and further study is required to compare their final heights with those of NW children.
The peak LH level in the LHRH test tended to be lower in obese girls. It has been thought that obesity causes a relative suppression of LH levels, and because of that, obese girls with breast budding might enter central puberty later than nonoverweight girls [24]. In this study, being OW/obese was unlikely to be associated with the risk of progressing to central puberty before age 9, and progression-free survival was significantly higher in the OW group than the NW group.
However, pubertal progression was not slow in all OW girls, and it progressed rapidly in a subgroup of these children. OW girls with rapid pubertal progression had more advanced BA and higher LH, FSH, and E2 levels at their initial work-ups than OW girls with slow pubertal progression in this study. Our results suggest that although pubertal progression is slower in OW girls than NW girls, those with advanced BA and elevated hormone levels, especially an increased initial LH level, should be followed carefully, and timely intervention should be provided when required.
Within the OW group, although CA and BA at the onset of central puberty were older in the OW-SP group, BA advancement at central pubertal onset did not differ significantly between the OW-RP and OW-SP groups. BA advancement itself should be a result, rather than a cause, of pubertal progression, and when a certain number of stimuli has accumulated, the hypothalamic-pituitary-gonadal axis begins to be activated. A threshold effect for central puberty progression can be supposed, and BA advancement by 18 to 21 months might be used as a surrogate marker for the timing of central puberty progression.
When central puberty was strongly suspected by the progression of breast development and basal LH elevation, we deemed the LHRH test to be unnecessary, especially in children aged 9 years or older. Actually, even basal LH measurement was not performed in many children after 9 years of age; however, they were excluded from this study because we enrolled only laboratory-confirmed cases. To satisfy the reimbursement criteria in Korea, the LHRH test was more likely to be performed in girls younger than 9 years than in girls older than that.
Adipomastia in OW children can be misidentified as precocious breast development by parents. When precocious breast development was deemed unlikely after history taking and a physical examination, observation without laboratory workup was recommended, and parents were given brief advice on lifestyle modifications. Of course, those children were excluded from this study.
This study has some limitations. First, the sample size of OW girls with precocious puberty was relatively small, and the sample with pubertal progression was even smaller. Second, this is a single-center retrospective cohort study. Participants were enrolled from the patient database of our hospital and might not represent the general population. Third, parental anxiety and preference might have influenced the number of clinic visits and/or the aggressiveness of the workup. Fourth, the duration of follow-up might be insufficient, and we have no information about those who were lost to follow-up, which could have biased our study results.
In conclusion, pubertal progression in OW girls with precocious pubertal development seems to be slower than that in their NW counterparts. However, it can progress rapidly in OW girls with pronounced BA advancement and high gonadotropin and sex steroid levels at their initial workup.