The association between vitamin D deficiency and metabolic syndrome in Ukrainian adolescents with overweight and obesity
Article information

Abstract
Purpose
This work aims to determine the association between vitamin D deficiency and metabolic syndrome in overweight and obese adolescents from Ukraine.
Methods
Anthropometric measurements were taken and general and biochemical examinations were performed on 136 obese and overweight adolescents and 60 adolescents with normal body weight. The vitamin D status was determined using 25-hydroxyvitamin D (25(OH)D) (calcidiol) levels in blood serum. To establish the factors influencing vitamin D status, the subjects were asked to answer a questionnaire and 2007 International Diabetes Federation diagnostic criteria were used to determine the incidence of metabolic syndrome. All research results were processed statistically.
Results
A calcidiol sufficiency level was found in 3.9% of obese adolescents and 6.7% of overweight adolescents. Metabolic syndrome was found in 64.4% of obese adolescents with vitamin D deficiency, and in 26.2% of overweight adolescents. Factors associated with an increased risk of developing vitamin D deficiency in adolescents with metabolic syndrome included male sex (P=0.042), low income per family member (P=0.040), daily milk consumption of up to 1 cup per day (P=0.001), physical activity (P=0.001), duration of outdoor stays (P=0.001), and passive rest in front of a computer or television (P=0.001). Adolescents with metabolic syndrome were found predominance of body mass index (P<0.001), waist circumference (P<0.001), fasting blood glucose level (P<0.001), and decreased calcidiol level (P=0.022). Among metabolic syndrome components, vitamin D deficiency was strongly associated with waist circumference and increased fasting blood glucose (P<0.05).
Conclusions
Vitamin D deficiency is prevalent in overweight and obese adolescents from Ukraine. Vitamin D deficiency is associated with metabolic syndrome criteria in overweight and obese adolescents.
Highlights
· Ukrainian adolescents have low serum calcidiol levels.
· Prevalence of metabolic syndrome criteria is strongly associated with vitamin D levels in overweight and obese adolescents.
· Factors associated with vitamin D deficiency are sex, passive and physical activity, socioeconomic status.
Introduction
Vitamin D ensures not only the absorption of calcium from the intestines and the maintenance of a healthy bone tissue, but also affects the activities of many organs and systems. The widespread prevalence of vitamin D insufficiency and deficiency among adults and children has acquired the status of a pandemic, prompting the study of its pleiotropic effects on the human body at different physiological stages and tissue and cellular levels [1-3]. Vitamin D deficiency is often combined with cardiovascular diseases, hypertension, metabolic disorders, autoimmune diseases, and cognitive impairments [3-6].
Vitamin D deficiency is believed to occur in people who have been exposed to insufficient sunlight, engage in low levels of physical activity, stay indoors for extended periods, and eat poorly. This is particularly true for adolescents, who spend considerable time in front of the computer and do eat not enough foods rich in vitamin D [6,7].
Studies of vitamin D status have established that, among adolescents in Ukraine, vitamin D deficiency is associated with an elevated body mass index (BMI), with 57.3% of those with normal body weight, 70.7% overweight subjects, and 77.1% of obese adolescents showing signs of vitamin D deficiency [8].
Vitamin D status is highly dependent on seasonal cycles. According to laboratory studies, the mean serum 25-hydroxycholecalciferol (calcidiol) level in Polish adolescents as measured in October was 55.4±14.0 nmol/L. Comparable measurements taken in March showed a mean serum level of 36.4±13.5 nmol/L. In the spring, vitamin D deficiency was reported in 84.2% of all children [9]. Among German adolescents, 87% had vitamin D insufficiency or deficiency and this prevalence was 94% among adolescents who had immigrated to Germany [10].
Such a widespread prevalence among adolescents makes vitamin D deficiency an important public health problem, as diseases associated with vitamin D status in adolescents often move into adulthood and affect work capacity, quality of life, and lifestyle [6,7,11]. Vitamin D status has been linked to metabolic syndrome, which is a serious health risk not only for adults but children and adolescents as well [12]. The prevalence of metabolic syndrome ranges from 0.2% to 39%, depending on the criteria used [13]. In addition, a systematic review has shown that the occurrence rate of metabolic syndrome among adolescents was 3.3% in general populations, 11.9% among overweight adolescents, and 29.2% among obese adolescents [14].
Given current trends in the prevalence of obesity and significant increases in the frequency of diagnoses of metabolic syndrome in overweight and obese adolescents, early detection of the development of metabolic syndrome factors should contribute to the delivery of preventive measures to reduce the development of cardiometabolic disorders [15].
Multiple meta-analyses have found that metabolic syndrome is associate with a 2-fold increase in cardiovascular disorders and a 1.5-fold increase in all-cause mortality [16].
According to a study that used International Diabetes Federation criteria to gauge the prevalence of metabolic syndrome among adolescents, the frequency among boys is 1.24 times higher than among girls. Among the most prevalent criteria, researchers singled out low levels of high-density lipoprotein cholesterol (HDL-C) (56.2%) and abdominal obesity (27.8%) [17].
Vitamin D levels and metabolic syndrome are reportedly linked in adults and older people, depending on age, sex, and countries. Separate studies of metabolic syndrome components found that low triglyceride and high HDL-C levels are correlated with high vitamin D levels [18]. Researchers have also linked vitamin D status with blood glucose levels and systolic blood pressure [19-21]. However, little attention has been paid to the relationship between vitamin D status and metabolic syndrome components in overweight and obese adolescents. The aim of the study was to determine the association between vitamin D deficiency and metabolic syndrome in overweight and obese adolescents in Ukraine.
Materials and methods
1. Participants
A total of 136 adolescents (76 with obesity and 60 who were overweight) were examined. All adolescents were aged 12 to 17 years. Their mean age was 15.1±2.1 years. All children were Caucasians and lived in the Ternopil region of Ukraine.
To compare serum calcidiol levels in overweight and obese adolescents with levels in adolescents with normal body weight, a control group of 60 healthy children of comparable age and sex was presented.
The inclusion criteria for the study were: a BMI at or above the 85th percentile according to age-sex nomograms, written informed consent of parents and patients, and availability between November and March of 2020. The exclusion criteria were: obesity due to endocrine diseases (hypercorticism, hypopituitarism, or hypothyroidism), or hypothalamic-pituitary injury; use of anticonvulsant drugs, glucocorticoids, or drugs that affect blood pressure; hereditary and congenital disorders; diabetes mellitus; and failure to supply informed consent.
The study followed the ethical standards of the Helsinki Declaration of 1975, as revised in 2013, as well as national laws. Patient safety rules and the ethical standards and procedures for research on human beings (in effect in the year 2000) were followed. The Ethics Committee of the I. Horbachevsky Ternopil National Medical University granted permission to carry out this study (protocol No. 58) on April 29, 2020.
2. Methods
Vitamin D status was determined by measuring the level of calcidiol in blood serum using an immunoassay method, 25-OH Vitamin D ELISA test kits (EUROIMMUN, Lubeck, Germany), and a Multiskan FC analyzer (Thermo Scientific, Waltham, MA, USA), with an intra-assay coefficient of variation (CV) of 3.2% to 4.9% and an interassay CV of 4.0% to 7.8%. Assessments of calcidiol levels followed the recommendations of the Endocrine Society Clinical Practice Guidelines [22]. A calcidiol level of 30 to 100 ng/mL was considered sufficient; vitamin D insufficiency was defined as a calcidiol level between 20 and 29 ng/mL, and vitamin D deficiency defined as a calcidiol level below 20 ng/mL. To establish an association between vitamin D status and the criteria for metabolic syndrome in overweight and obese adolescents with vitamin D deficiency, children were divided into 2 subgroups: those with metabolic syndrome and those without metabolic syndrome.
Diagnoses of metabolic syndrome in adolescents used 2007 International Diabetes Federation (IDF) criteria [23]. According to these criteria, children between 10 and 16 years of age have metabolic syndrome if they have abdominal obesity (>90th percentile or adult cutoff if lower) and the presence of 2 or more other clinical features: triglycerides >1.7 mmol/L (≥150 mg/dL), HDL-C <1.03 mmol/L (<40 mg/dL), systolic blood pressure ≥130 mmHg or diastolic blood pressure ≥85 mmHg, fasting plasma glucose >5.6 mmol/L (>100 mg/dL) or previously diagnosed type 2 diabetes. For children older than 16, a diagnosis of metabolic syndrome required abdominal obesity (defined as a waist circumference [WC] ≥94 cm for boys and ≥80 cm for girls, and the presence of 2 or more metabolic syndrome clinical features: triglycerides >1.7 mmol/L (≥150 mg/dL), HDL-C <1.03 mmol/L (<40 mg/dL) in males and <1.29 mmol/L (<50 mg/dL) in females, systolic blood pressure ≥130 mmHg or diastolic blood pressure ≥85 mmHg, treatment of previously diagnosed hypertension, fasting plasma glucose >5.6 mmol/L (>100 mg/dL) or previously diagnosed type 2 diabetes [23].
Anthropometric measurements included body weight (to an accuracy of 0.1 kg), height (within 0.1 cm), and WC. Measurements were carried out using generally accepted methods with the help of a floor weight scale, height meter, and flexible centimeter tape measure. To measure WC, a tape measure was placed around the torso at a point midway between the iliac crest and the costal margin (lower rib).
BMI was assessed by percentile curves. A child was considered overweight when the BMI was greater than the 85th to 97th percentile, obese when the BMI exceeded the 97th percentile, and of normal body weight when the BMI was less than the 85th percentile, according to sex and age charts based on World Health Organization recommendations [24].
Measurement of blood pressure was performed on both upper limbs 3 times in a sitting position using a mechanical sphygmomanometer with a cuff.
To gauge lipid metabolism, serum concentrations of HDL-C and triglycerides were measured using an enzymatic colorimetric method, a cholesterol reagent, and a Cobas c111 automatic analyzer (Roche Diagnostics, Rotkreuz, Switzerland). The fasting blood glucose (FBG) level in blood serum were measured by the glucose oxidase method.
To determine the factors influencing vitamin D status, adolescents were asked to complete a questionnaire that asked for the age and sex of the child, place of residence (city or rural areas), income per family member (average, above or below the average living wage), daily milk consumption (up to 1 cup per day, between 1 and 3 cups per day, or more than 3 cups per day), physical activity levels as measured by the number of active hours per week (up to 2 hours, from 2 to 5 hours, or more than 5 hours), duration of daily stays outdoors (up to 30 minutes or more than 30 minutes), passive rest time in front of a computer or television (up to 2 hours per day, 2 to 4 hours per day, or more than 4 hours per day).
3. Statistical analysis
Statistical analysis was conducted using Statistica 12.0 software and Microsoft Excel (2013). The normality of the distribution of features in the variation series was assessed by Kolmogorov-Smirnov tests. In the case of a normal distribution of features, the data were presented as the mean and standard deviation. In cases of nonnormal distribution, we calculated the median and interquartile range. Comparisons of 2 independent samples with a normal distribution used Studen t-tests, and Mann-Whitney U-tests were applied to parameters with a nonnormal distribution. Two-tailed Fisher exact test and Pearson chi-square tests were used to analyze the frequency tables. An odds ratio (OR) and its 95% confidence interval (CI) were calculated to evaluate the impact of each factor. Logistic regression was performed to find the association between vitamin D status and criteria of metabolic syndrome. Differences between values were considered significant at P<0.05.
Results
A total of 196 adolescents were found to have low serum calcidiol levels (Table 1). The median serum calcidiol values were 12.71 ng/mL (9.36–17.37 ng/mL) in obese adolescents and 14.69 ng/mL (10.27–20.30 ng/mL) in overweight adolescents. In adolescents with normal body weight, the median value was 17.90 ng/mL (12.16–24.93 ng/mL). The medians values were significantly lower in overweight (P=0.011) and obese adolescents compared to those with a normal body weight (P<0.001), as determined by the Mann-Whitney U-test.
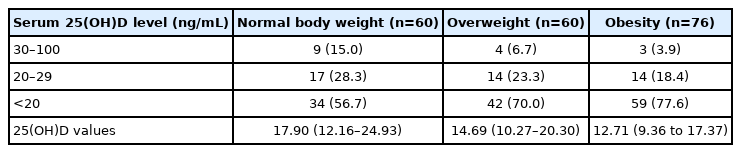
Vitamin D levels in adolescents depending on body mass index (n=196)
In overweight and obese adolescents, metabolic syndrome, as diagnosed by abdominal obesity and the presence of 2 or more other clinical features, was found in 57 teens (41.9%). Among the examined adolescents, 76 (75.2%) with vitamin D deficiency, and 13 (46.4%) with vitamin D insufficiency had abdominal obesity. A clinical features analysis established that, among obese and overweight adolescents with vitamin D deficiency, metabolic syndrome was found in 49 teens (48.5%). Metabolic syndrome among obese adolescents with vitamin D deficiency was found in 38 (64.4%), and among overweight adolescents with vitamin D deficiency it was found in 11 (26.2%). Among overweight and obese adolescents with vitamin D insufficiency metabolic syndrome was found in 8 teens (28.6%). In adolescents with sufficient vitamin D level, no metabolic syndrome was seen.
The frequency of manifestations of clinical characteristics affecting vitamin D status in overweight and obese adolescents with vitamin D deficiency, according to the presence of metabolic syndrome, are presented in Table 2.
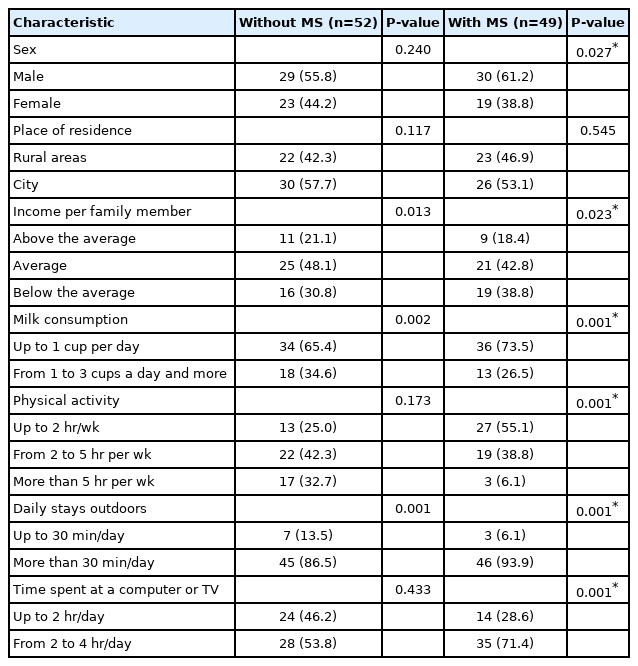
Frequency of manifestations of characteristics in overweight and obese adolescents with vitamin D deficiency, depending on the presence of metabolic syndrome (MS) (n=101)
The metabolic syndrome components found in overweight and obese Ukrainian adolescents are presented in Table 3, according to the frequency of vitamin D levels. A triglyceride level ≥1.7 mmol/L (≥150 mg/dL), which is a metabolic syndrome criteria, was found more often in overweight and obese adolescents with vitamin D deficiency compared with those with sufficient vitamin D levels. Hypoalphalipoproteinemia was found in 48.5% of overweight and obese adolescents with vitamin D deficiency compared with 14.3% of those with sufficient vitamin D levels.
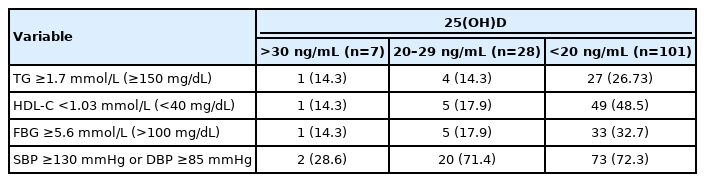
Frequency of metabolic syndrome components in overweight and obese adolescents depending on vitamin D level (n=136)
A FBG level ≥5.6 mmol/L (>100 mg/dL) was found in 33 of 101 adolescents (32.7%) with vitamin D deficiency who were obese or overweight. Among all 101 adolescents with vitamin D deficiency, increased blood pressure was found in 73 (72.3%) of those who were obese or overweight and in just 2 overweight and obese adolescents with sufficient vitamin D levels (28.6%).
In a comparison of metabolic syndrome components, BMI, and vitamin D status, a significant predominance of BMI (P<0.001), WC (P<0.001), FBG level (P<0.001), and a decreased calcidiol level (P=0.022) was found in adolescents with metabolic syndrome (Table 4).
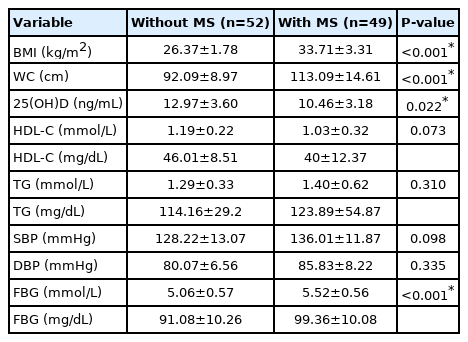
The 25(OH)D level and main criteria variables of metabolic syndrome in overweight and obese adolescents with vitamin D deficiency (n=101)
The clinical characteristics associated with the risk of adolescents with metabolic syndrome developing vitamin D deficiency (based on the results of 2-tailed Fisher exact tests) are presented in Table 5.
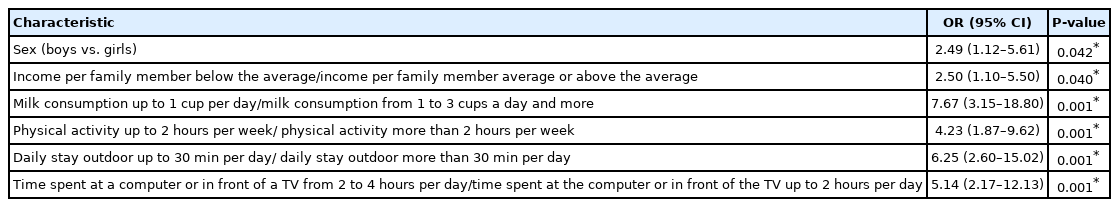
Clinical characteristics associated with the risk of developing vitamin D deficiency in adolescents with metabolic syndrome (n=57)
The relationship between serum calcidiol levels in overweight and obese adolescents and metabolic syndrome components was determined by logistic regression analysis. Among the components, serum vitamin D was strongly interrelated with WC and increased FBG levels (Table 6). In model 1, adjusted for age and sex, the OR for WC was 1.38 (95% CI, 1.15–1.62; P=0.024), and for FBG it was 2.48 (95% CI, 1.52–5.06; P=0.016). Both ORs were statistically significant. A statistically significant relationship between serum calcidiol and triglycerides, blood pressure, and HDL-C was not defined in model 1. In model 2, adjusted for age, sex, BMI, income per family member, place of residence, physical activity, and passive time at a computer or television, the statistically significant OR for WC was 1.24 (95% CI, 1.04–1.45; P=0.039), and for FBG the OR was 1.75 (95% CI, 1.29–2.31; P=0.009). Model 2 produced no significant relationship between serum calcidiol levels and triglycerides, HDL-C, and systolic or diastolic blood pressure.
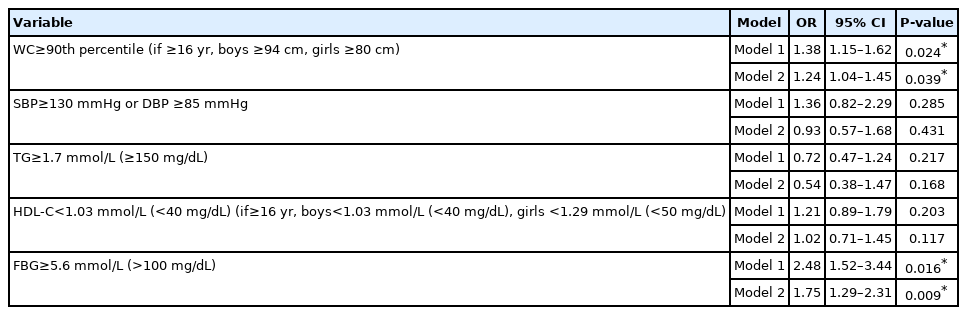
Relationship between serum 25(OH)D levels and metabolic syndrome components (n=136)
Discussion
We found vitamin D deficiency in 77.6% of obese adolescents, in whom the mean serum calcidiol level was 12.71 ng/mL (9.36–17.37 ng/mL), which indicates a significant prevalence of vitamin D deficiency among adolescents in Ukraine. Similar results have been reported for Norwegian adolescents, 60.2% of whom had vitamin D deficiency [7] and for Iranian adolescents, 96% of whom had vitamin D deficiency [25,26].
Metabolic syndrome (as defined by IDF criteria) was found in 41.91% of overweight and obese adolescents, a share that was higher than reported for Brazilian adolescents (28.7%) or Iranian adolescents (7.6%) [12,17]. However, in systematic reviews, estimates of the prevalence of metabolic syndrome in children and adolescents who are overweight or obesity range from 2.8% to 66%, and in American adolescents the figure is 40% [14,16,17].
Our results show that the rate of metabolic syndrome among obese and overweight adolescents with vitamin D deficiency was 48.5%, which is consistent with the results of a Korean study in which up to 56% of patients with metabolic syndrome had vitamin D deficiency, but higher than those of an Italian study that found 30.1% of adolescents with vitamin D deficiency had metabolic syndrome [27,28]. A relationship between obesity and vitamin D deficiency has been reported by many research teams. Their findings indicate that progressive obesity reduces levels of calcidiol, which circulates in the blood due to its accumulation in adipose tissue; decreases the bioavailability of calcidiol; and helps reduce the rate of hydroxylation in the liver due to nonalcoholic fatty liver disease [29,30]. Interrelationships have been reported between the blood level of vitamin D metabolites and metabolic syndrome criteria, including an increase in proatherogenic lipids, a decrease in HDL-C, and increases in insulin resistance, glycemia, and blood pressure [30,31].
Vitamin D status is also associated with a variety of risk factors for the development of obesity and manifestations of metabolic syndrome criteria.
Analysis of the factors associated with vitamin D deficiency confirms that obese male adolescents with metabolic syndrome have a higher tendency to develop vitamin D deficiency compared with their female counterparts. An income per family member below the average, milk consumption habits of no more than 1 cup per day, low physical activity, short daily stays outdoors, and considerable time spent with a computer or television were also important factors associated with a higher tendency to develop vitamin D deficiency.
The greater tendency for boys to develop vitamin D deficiency seen in our study may have an activating effect on 1α-hydroxylase and hydroxylation through sex hormones and growth factors [25,26]. The greater prevalence of abdominal obesity in boys can also lead to decreased vitamin D due to sequestration in fat tissue [29,30,32].
These data support the hypothesis that an active lifestyle and longer daily stays outdoors may reduce the risks of developing vitamin D deficiency. The data obtained during the study showed a similar vitamin D status in boys and girls, which is consistent the findings of other researchers with respect to calcidiol levels among adolescents with a lower economic status and those who rate their health as relatively poor [25,26].
The relationship between serum calcidiol and metabolic syndrome criteria is the subject of active research [18,31,33,34]. The prevalence of metabolic syndrome components in overweight and obese adolescents with vitamin D deficiency has been confirmed by these studies, which identify abdominal obesity as the main risk factor for metabolic syndrome in young people [17,32]. The findings confirm that WC is not only a metabolic syndrome criterion according to IDF but also an indicator of serum calcidiol levels, as confirmed by logistic regression analysis. Data are available supplying correlations between visceral fat and all components of metabolic syndrome. Adipose tissue and associated inflammatory alterations determine insulin resistance, which is characterized by reduced use of glucose by cells and changes to the regulation and liver production of glucose. In addition, visceral obesity and insulin resistance are associated with increased production of adipokines, which can cause oxidative stress, an increase in inflammation markers, and endothelial dysfunction [33,35].
Hyperglycemia was found in only one-third of overweight and obese adolescents with vitamin D deficiency. According to logistic regression analysis, this had a significant effect of on calcidiol levels. Previous research has established an inverse correlation between blood glucose and calcidiol levels in patients with metabolic syndrome, a finding that is consistent with studies conducted in Taiwan, Korea [27,34]. The relationship between calcidiol levels and the development of hyperglycemia and diabetes, combined with the fact that calcidiol can directly affect the secretory function of pancreatic β cells through nuclear receptors for calcidiol, suggest that cell sensitivity to insulin through insulin-receptor expression can be regulated by intracellular calcium [36].
Our data on the prevalence of hypertension confirm the results of previous studies of overweight adolescents with vitamin D deficiency and indicate that blood pressure is a marker of the early development of metabolic syndrome [32].
Recent studies have shown that vitamin D plays an important role in maintaining blood pressure due to the proliferation of arterial smooth muscle cells, regulation of the renin-angiotensin system, and increases in intracellular calcium, which helps reduce renin level [20,21]. This association between calcidiol and blood pressure is consistent with the findings of other studies reporting that calcidiol status is inversely associated with systolic blood pressure, renin, and angiotensin II concentrations, and is less associated with diastolic blood pressure. It is likely that 1,25-dihydroxyvitamin D, an active vitamin D metabolite, reduces the activity of the renin-angiotensin system and inhibits renin synthesis [20,28].
Our study establishes that, in adolescents with vitamin D deficiency and metabolic syndrome, triglyceride levels were significantly higher and HDL-C levels were significantly lower compared with adolescents with vitamin D deficiency but without metabolic syndrome. Logistic regression analysis did not identify a significant effect of HDL-C and triglycerides on calcidiol levels in blood serum. Other researchers have published similar findings: calcidiol and triglycerides (r=-0.135; 95% CI: -0.243 to -0.025) are weakly and inversely correlated while HDL-C (r=0.156; 95% CI, -0.021 to 0.324) has a direct correlation. These data show that, in adolescents, a higher serum calcidiol level is associated with a more favorable lipid profile [37]. We found that 26.7% of overweight and obese adolescents with vitamin D deficiency have hypertriglyceridemia, with that share rising to 48.5% in those who have hypoalphalipoproteinemia.
In conclusion, we found that the prevalence of metabolic syndrome criteria in overweight and obese adolescents was strongly associated with vitamin D levels. Further studies are needed to determine the relationship between certain metabolic syndrome criteria during adolescence and cardiovascular disease and diabetes mellitus in adulthood.
Notes
Conflicts of interest
No potential conflict of interest relevant to this article was reported.
Funding
The study was supported by the Ministry of Health of Ukraine for I. Horbachevsky Ternopil National Medical University.
Data availability
The data that support the findings of this study can be provided by the corresponding author upon reasonable request.
Author contribution
Conceptualization: AS, HP; Data curation: OS; Formal analysis: AS, VF; Funding acquisition: HP, VF; Methodology: AS, OS, VF; Project administration: HP; Visualization: AS, HP; Writing - original draft: AS; Writing - review & editing: AS, HP, OS