Comparison of different criteria for the definition of insulin resistance and its relationship to metabolic risk in children and adolescents
Article information

Abstract
Purpose
Childhood obesity frequently persists into adulthood and is associated with insulin resistance (IR) and increased long-term morbidity and mortality. We compared IR criteria concerning 'age-specific cutoff point' (ACOP) and ‘fixed cutoff point’ (FCOP) for the identification of IR and investigated their correlation with metabolic syndrome (MS).
Methods
Data were acquired from the 5th Korea National Health and Nutrition Examination Survey (2010–2011). Participants ranged from 10 to 17 years of age and underwent fasting plasma glucose, insulin concentration, and lipid panel measurements. High fasting plasma insulin levels or increased homeostatic model assessment insulin resistance (HOMA-IR) were defined as IR. We analyzed MS and IR frequencies according to FCOP or ACOP.
Results
Among 719 participants, 165 (22.9%) were overweight or obese based on their body mass index. We found no prevalence of MS in underweight/normal weight participants and 12.7% prevalence rate in overweight or obese participants. IR according to ACOP was more closely associated with MS than IR according to FCOP. No differences were found in predicting the frequency of MS using FCOP or ACOP in both fasting plasma insulin and HOMA-IR.
Conclusions
The frequency of MS in participants with IR defined using ACOP and FCOP was similar. However, IR using ACOP was more closely associated with MS than IR using FCOP.
Introduction
Rising prevalence rates of overweight and obesity in numerous countries have been described as a global pandemic [1,2]. High rates of childhood obesity lead to associated health consequences ranging from psychosocial consequences to adverse metabolic effects on blood pressure (BP), total cholesterol (TC), triglyceride (TG) concentrations, and insulin resistance (IR) [3]. IR and glucose intolerance are frequent in children and adolescents with obesity and lead to a significant risk of hypertension and cardiovascular disease (CVD), early atherosclerosis, progressive obesity, acanthosis nigricans, dyslipidemia, fatty liver, polycystic ovarian syndrome (PCOS), and type 2 diabetes (T2DM) [4]. IR is also considered a trigger factor in metabolic syndrome (MS) that leads to morbidity and mortality [2,5-9].
Early detection of IR is important to prevent these associated health consequences. There is a lack of clarity as to how IR in childhood is best assessed, in what clinical disorders it occurs, and whether it can be treated or prevented [4,10]. The gold standard for assessing IR in humans is the hyperinsulinemic-euglycemic clamp assessment [11]. However, the hyperinsulinemic-euglycemic clamp is not applicable in the clinical setting as it is an invasive procedure and technically complex, especially for use in the pediatric age group [2], and it can only be used for research purposes [4]. Therefore, methods such as fasting plasma insulin level, fasting plasma glucose (FPG) to insulin ratio (FGIR), homeostatic model assessment IR (HOMA-IR), and the quantitative insulin-sensitivity check index (QUICKI) are frequently used for population screening [2,4]. HOMA-IR has been found to be considerably more reliable than FGIR and QUICKI for quantifying the degree of IR in children with obesity [4,12]. In addition, FPG variations in the pediatric population are rarely significant; therefore, some authors propose that fasting plasma insulin alone can be used to diagnose IR in children [2,13,14]. Moreover, there is no strict definition for IR in children or adolescents.
Puberty is associated with a temporary increase in IR; however, the cause is not fully understood. IR is more closely related with age than with pubertal stage; thus, it is possible that specific fasting plasma insulin and HOMA-IR values by age group and sex may be applicable [2,15,16]. Despite an acceptable HOMA-IR cutoff limit for IR of 2.5 in adults, corresponding values for IR in prepubertal and pubertal children and adolescents are scare [4,17]. Here, we classify the value of fasting plasma insulin and HOMA-IR by age group and re-name it 'age-specific cutoff point' (ACOP). Moreover, 'fixed cutoff point' (FCOP) refers to the most used cutoff point described in the literature for fasting plasma insulin and for HOMA-IR [2,12,18,19].
Our study aimed to compare measures of IR using ACOP and FCOP in fasting plasma insulin and HOMA-IR for diagnosing IR as a predictor of MS prevalence.
Materials and methods
1. Data collection
Data were obtained from the 5th Korea National Health and Nutrition Examination Survey (KNHANES V, 2010–2011). KNHANES V was a cross-sectional and nationally representative survey based on a stratified sampling design conducted by the Korean Ministry of Health and Welfare. A total of 11,230 individuals from 10 to 17 years of age were included in the KNHANES V. After providing informed consent, participants and their parents were interviewed at home and the participants underwent various examinations including blood tests. Weight was measured with a medical balance (GL-6000-20, CASKOREA, Seoul, Korea) and height was measured to the nearest 0.1 cm using a wall-mounted stadiometer (SECA 220, SECA, Hamburg, Germany). Body mass index (BMI) was calculated by dividing the weight (kg) by the square of the height (m2). Waist circumference (WC) was measured to the nearest 0.1 cm at the narrowest point between the lower end of the last rib and the upper rim of the right iliac crest. BP was measured after participants were asked to rest in a sitting position for 5 minutes. The systolic and diastolic BP was recorded three times, and the mean value was used for analysis.
Blood samples were transported daily to the Central Laboratory (NEODIN Medical Institute, Seoul, Korea). FPG, TG, and high-density lipoprotein cholesterol (HDL-C) concentrations were measured according to standard procedures using a Hitachi Automatic Analyzer 7600 (Hitachi, Tokyo, Japan). Body composition was measured using a standardized method involving dual energy x-ray absorptiometry ( DEXA ; DISCOVERY-W fan-beam densitometer Hologic Inc., Bedford, MA, USA). Insulin concentration was measured with a radioimmunoassay kit (1470 WIZARD gamma-counter PerkinElmer, Turku, Finland). Insulin sensitivity was evaluated according to HOMA-IR, which was calculated using the following equation: HOMA-IR=fasting plasma insulin (μU/mL)×FPG (mg/dL)/405 [17].
2. Study design
Of 11,230 participants, a subsample (n=1,252) aged 10–17 years underwent FPG, insulin level, and lipid panel measurements. Participants for whom data were missing were excluded (n=494). Participants with chronic systemic diseases such as T2DM, thyroid disease, rheumatoid arthritis, cancer, CVD, and other disabled status were excluded (n=30). Nine participants who had not fasted for at least 8 hours prior to testing were also excluded. Thus, a total of 719 participants (389 males, 330 females) were assessed. Participants were classified as underweight/normal weight (UN group) if their BMI was lower than the 85th percentile, and overweight/obese (OB group) if their BMI was higher than or equal to the 85th percentile, based on the 2017 Korean National Growth Charts [20].
Hyperinsulinemia, used as a diagnostic marker of IR, was identified when the fasting plasma insulin value was above the cutoff point according to (A) or (B):
(A) 15 μU/mL, FCOP [19]
(B) ACOP by sex (>95th percentile of fasting plasma insulin, as reported in a previous study [5]), as follows:
• 10–11 years: 16.0 μU/mL (male), 18.3 μU/mL (female)
• 11–12 years: 20.1 μU/mL (male), 21.7 μU/mL (female)
• 12–13 years: 21.0 μU/mL (male), 24.8 μU/mL (female)
• 13–14 years: 20.4 μU/mL (male), 23.7 μU/mL (female)
• 14–15years: 21.7 μU/mL (male), 18.2 μU/mL (female)
• 15–16 years: 20.2 μU/mL (male), 18.8 μU/mL (female)
• 16–17 years: 18.5 μU/mL (male), 19.8 μU/mL (female)
HOMA-IR was the other indicator of IR, which was considered when the value was above the following cutoff points:
(A) 3.16, FCOP [12]
(B) ACOP by sex (>95th percentile, as reported in a previous study [5]), as follows:
• 10–11 years: 3.70 (male), 4.10 (female)
• 11–12 years: 4.40 (male), 4.87 (female)
• 12–13 years: 4.52 (male), 5.65 (female)
• 13–14 years: 4.58 (male), 5.45 (female)
• 14–15 years: 5.01 (male), 4.15 (female)
• 15–16 years: 4.50 (male), 4.09 (female)
• 16–17 years: 4.08 (male), 4.50 (female)
We used the International Diabetes Federation (IDF) MS definition for participants aged >10 years [21]. Central obesity was defined as a WC ≥90th percentile for age and sex except in females aged ≥16 years (WC≥80 cm) and in males aged ≥16 years (WC≥90 cm) [20]. MS was diagnosed when two or more of the following clinical features were detected: fasting TG level ≥130 mg/dL [22,23], FPG concentration ≥100 mg/dL (5.5 mmol/L), systolic BP ≥90th percentile or diastolic BP ≥90th percentile, and HDL-C <40 mg/dL for both sexes, except in females aged ≥16 years (HDL-C concentrations <50 mg/dL) [21].
3. Statistical analysis
Data are expressed as mean±standard deviation or as numbers and percentages based on the characteristics of the variables. We used logistic regression analysis considering sex stratification to determine the association between IR and MS. The association between MS and obesity-related factors was subjected to logistic regression analysis. To compare the differences in performance (FCOP, ACOP), the areas under the curves (AUCs) were calculated using the DeLong method. A comparison of dyslipidemia frequencies between FCOP and ACOP was analyzed using a chi-square test. All statistical analyses were performed using SAS 9.4 (SAS Institute, Cary, NC, USA) and a P-value below 0.05 was considered statistically significant.
Results
1. Characteristics of the study participants aged 10-17 years
Among the 719 participants, 165 (22.9%) were overweight or obese based on their BMI (Table 1). In the OB group, the mean values of weight, weight z-score, BMI z-score, fasting plasma insulin, WC, systolic BP, FPG levels, lipid panel, fat mass (FM), fat mass index (FMI), and HOMA-IR were significantly higher relative to participants in the UN group.

Baseline characteristics of participants in the KNHANES V (2010–2011)
2. The prevalence of MS
The prevalence of MS among the participants was 2.9% (n=21) with no prevalence of MS in the UN group, and 12.7% prevalence in the OB group. Among the OB group, males had a higher prevalence of MS (7.2%) than females (5.5%). Contributing factors for MS such as central obesity, impaired fasting glucose, hypertension, hypertriglyceridemia, and low HDL-C concentrations were observed in 47.6%, 11.2%, 8.6%, 30.5%, and 38.6% of the OB group, respectively. The prevalence rates for IR in the OB group, using fasting plasma insulin and HOMA-IR with ACOP, were 35.9% and 35.9%, respectively. Using fasting plasma insulin and HOMA-IR with FCOP, the prevalence rates for IR were 58.5% and 63.7%, respectively (Table 2).
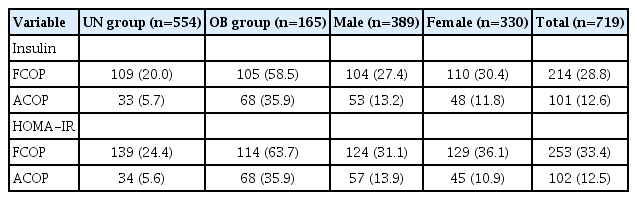
The incidence of insulin resistance using criteria stratified according to body mass index and sex
Using fasting plasma insulin or HOMA-IR according to ACOP as compared to FCOP, there was concordance in 101 (43.7%) and 102 participants (37.5%), respectively, and no discrepancy for the diagnosis of IR. However, ACOP was consonant with FCOP in 505 (100%) and 466 participants (100%) for fasting plasma insulin and HOMA-IR, respectively, for a diagnosis of the absence of IR. Moreover, there was discrepancy in 113 (56.3%) and 151 cases (62.5%), respectively (Table 3). The frequencies (%) of dyslipidemia of participants with IR according to fasting plasma insulin and HOMA-IR were significantly different in TG levels (Table 4).
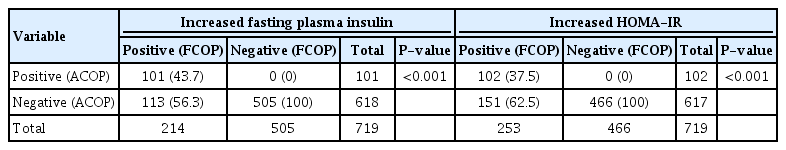
Distribution of subjects by insulin resistance according to different cutoff points (FCOP, ACOP) of fasting plasma insulin or HOMAIR
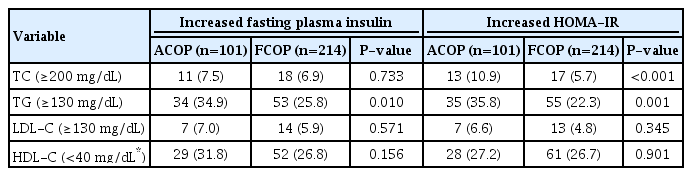
A comparison of dyslipidemia in insulin resistance assessed using different cutoff points
3. A comparison of ACOP and FCOP
In logistic regression models, a significant association between MS and fixed or age-specific model of IR (FCOP or ACOP) using fasting plasma insulin levels was observed (odds ratio [OR], 8.62; 95% confidence interval [CI], 3.14–23.71 and OR, 15.83; 95% CI, 4.62–54.22, respectively). Our findings suggest that children who had IR according to increased fixed or age-specific values of HOMA-IR were at greatest risk for MS compared with the UN group (OR, 8.63; 95% CI, 3.17–23.45 and OR, 30.45; 95% CI, 6.78–136.76, respectively). Among participants with IR, MS increased by 17.39-fold to 24.01-fold in males according to FCOP or ACOP, respectively, but MS increased by 9.65-fold only according to ACOP for fasting plasma insulin in females (Table 5). Obesity-related factors such as FM, percent body fat (PBF), trunk FM (%), and FMI also had a significant association with MS (OR, 1.24; 95% CI, 1.14–1.34, OR, 1.15; 95% CI, 1.08–1.23, OR, 1.19; 95% CI, 1.13–1.26 and OR, 1.75; 95% CI, 1.48–2.08, respectively).
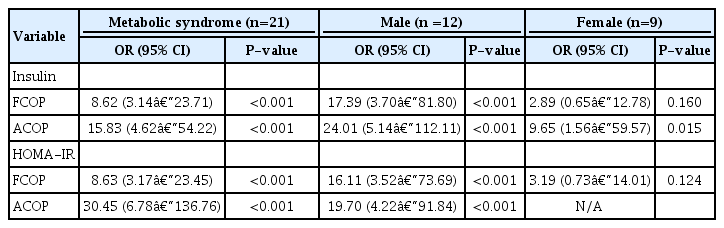
An analysis assessing the influence of insulin resistance on metabolic syndrome
No difference was observed in fasting plasma insulin versus HOMA-IR for predicting MS. HOMA-IR is required as a calculation step; therefore, fasting plasma insulin can be used alone as an easy test to diagnose IR in adolescents, as reported previously [2].
Table 6 depicts the sensitivity and specificity of each IR indicator for predicting MS. The AUCs for fasting plasma insulin were 0.767 (95% CI, 0.676–0.851) using FCOP and 0.770 (95% CI, 0.670–0.870) using ACOP. The AUCs for FCOP were 0.792 (95% CI, 0.680–0.904) and 0.729 (95% CI, 0.582–0.875) in males and females, respectively. The AUCs for ACOP were 0.774 (95% CI, 0.633–0.914) in males and 0.654 (95% CI, 0.481–0.827) in females. A comparison of the AUCs of each marker according to sex for MS showed no significant differences.

Areas under the curves in the ROC according to each indicator of insulin resistance based on metabolic syndrome
Discussion
In the present study, the mean values of FPG, TC, TG, low-density lipoprotein cholesterol, and HDL-C in the OB group were comparable to those of the UN group. Hypertriglyceridemia has been reported as the most frequently occurring form of dyslipidemia. [5] Li et al. [24] suggested that hypertriglyceridemia was significantly associated with the development of IR and MS. Several studies have reported varying prevalence rates of hypertriglyceridemia from different countries such as the United States (14.2%), Iran (49.9%), Turkey (21.7%), and Germany (33.9%) [25-28]. Similarly, despite differences in ethnicity, the frequency of hypertriglyceridemia was 30.5% in our study.
The prevalence of MS was 12.7% in the OB group aged from 10 to 17 years. For early detection of MS, we used values of abnormal TG ≥130 mg/dL [23] and modified criteria concerning the MS definition [21]. Similarly, previous studies based on the IDF definition reported the prevalence of MS in children and adolescents ranged from 0.7% to 4.5% in population-based studies and from 0.2% to 27.6% according to weight status [6-9]. We found that the prevalence of MS was higher among males (7.2%) than females (5.5%) during adolescence. Some studies have shown a positive association between females and the presence of IR [29,30]. However, similar to other studies, we observed no significant difference in IR frequency in relation to sex [2,5].
The frequency of IR identified using fasting plasma insulin was almost the same as that of IR identified using HOMA-IR. In our study, the prevalence of IR was between 35.9% and 63.7% in the OB group according to increased value of HOMA-IR or fasting plasma insulin (FCOP or ACOP). Similar observations have also been reported in previous studies [2,5,31]. In the United States, one study involving adolescents aged 12–19 years reported that the prevalence of IR in adolescents with obesity was 52.1% [32]. In another study of adolescents with obesity aged 12–15 years, IR was found in 38% of participants [33]. Gobato et al. [34] found that 29.1% of adolescents with obesity aged from 10–18 years were diagnosed with IR.
In our study, we found an association between FM, PBF, FMI, and IR and prevalence of MS. Moreover, accumulation of abdominal fat was associated with IR and MS. These findings were similar to those of previous reports [35,36]. Among participants with IR, MS increased by 17.39-fold to 24.01-fold in males according to FCOP or ACOP, respectively. In females with IR according to ACOP of fasting plasma insulin, MS increased by 9.65-fold. However, according to FCOP, no association was found between MS and IR. This suggests that IR using ACOP was more closely associated with MS than IR using FCOP. Statistically, this may be due to the low prevalence of MS (2.9%) in the present study. Nevertheless, as shown in Table 6, both ACOP and FCOP were robust tools for the assessment of MS. IR using ACOP had a slightly lower specificity but higher sensitivity for MS than using FCOP. However, the AUCs for fasting plasma insulin using ACOP were not significantly different from those using FCOP. A comparison of the AUCs of each marker for MS according to sex did not show any significant difference. The prevalence of MS in participants with IR defined using ACOP and FCOP was similar. Overall, the results suggest that FCOP is a convenient indicator for clinical application, but there is a limit to IR risk assessment.
Hyperinsulinemia, rather than impaired fasting glucose, may play the largest causal role in the pathology and progression of metabolic derangement. Impaired fasting glucose is a late indicator of metabolic dysregulation [37]. HOMA-IR was not different from fasting plasma insulin in predicting MS in the present study. Fasting plasma insulin might be a simple, economic, and easier method to predict MS, although HOMA-IR is required as a calculation step. Therefore, fasting plasma insulin may provide a simple marker for screening MS in children and adolescents.
In adults, Lunger et al. [38] evaluated methods for identifying IR in women with PCOS. The researchers set cutoff points for fasting insulin at <7 µU/mL. Ghasemi et al. [39] explored the relationship between early markers of IR with T2DM. The researchers elaborated on these findings through identifying optimal cutoff points (75% sensitivity) for fasting insulin at 7.51 μU/mL in women and 5.48 μU/mL in men. The fasting plasma insulin cutoff limit for IR in adolescents was found at a relatively higher level than in adults in the present study, and this may be related to puberty. A previous study demonstrated that IR could occur during puberty in relation to age and changes in body composition [2]. IR is more closely related to age than pubertal stage; therefore, it is possible to propose specific fasting plasma insulin and HOMA-IR values for each age group and sex [2,15,16].
In this large retrospective study, different measures of IR were used in analysis. However, our study had some limitations. One limitation was the small number of participants with MS and a lack of comparison with the gold standard methods for IR. Moreover, the present study involved a population of Korean healthy adolescents; therefore, these results may not be readily generalizable elsewhere.
In conclusion, the prevalence of MS in participants with IR defined using ACOP was similar to those found using FCOP. However, IR using ACOP was more closely associated with MS than IR using FCOP. To determine the clinical application of fasting plasma insulin and HOMA-IR values together with age, further longitudinal risk association studies are required.
Notes
Ethical statement
All participants in KNHANES V provided informed consent. The protocol for KNHANES V was approved by the Institutional Review Board (IRB) of the Korea Centers for Disease Control and Prevention. Our study was approved by the IRB of the Catholic University of Korea (IRB No. KC19ZASE0821).
Conflicts of interest
No potential conflict of interest relevant to this article was reported.
Acknowledgements
Statistical consultation was supported by a grant from the Korean Health Technology R&D Project, Ministry of Health & Welfare, Republic of Korea (grant number: HI14C1062).