Development of disease-specific growth charts in Turner syndrome and Noonan syndrome
Article information

Abstract
Many congenital diseases are associated with growth failure, and patients with these diseases have specific growth patterns. As the growth patterns of affected individuals differ from those of normal populations, it is challenging to detect additional conditions that can influence growth using standard growth charts. Disease-specific growth charts are thus very useful tools and can be helpful for understanding the growth pattern and pathogenesis of congenital diseases. In addition, disease-specific growth charts allow doctors to detect deviations from the usual growth patterns for early diagnosis of an additional condition and can be used to evaluate the effects of growth-promoting treatment for patients. When developing these charts, factors that can affect the reliability of the charts should be considered. These factors include the definition of the disease with growth failure, selection bias in the measurements used to develop the charts, secular trends of the subjects, the numbers of subjects of varying ages and ethnicities, and the statistical method used to develop the charts. In this review, we summarize the development of disease-specific growth charts for Japanese individuals with Turner syndrome and Noonan syndrome and evaluate the efforts to collect unbiased measurements of subjects with these diseases. These charts were the only available disease-specific growth charts of Turner syndrome and Noonan syndrome for Asian populations and were developed using a Japanese population. Therefore, when these charts are adopted for Asian populations other than Japanese, different growth patterns should be considered.
Introduction
Growth charts are vital tools used worldwide for evaluating the growth of children in clinical settings as well as public health examinations [1,2]. These charts enable physicians to compare the growth of an individual with that of the general population, assessing whether the individual has growth failure or not. Starting with such assessment, a physician can investigate a specific diagnosis for an individual with growth failure, although the diagnosis is usually determined by other findings such as clinical features, hormone levels, karyotyping, or bone radiographs.
Many congenital diseases are associated with growth failure, and patients with these diseases show characteristic growth patterns. As the growth patterns of affected individuals differ from those of the normal population, it is challenging to detect additional conditions that influence their growth using growth charts for the normal population. In clinical settings, it is essential for physicians to consider other possible contributory factors besides the established diagnosis. To that end, disease-specific growth charts are very useful and are necessary for several reasons [3]. First, they are helpful for understanding the growth pattern and pathogenesis of a disease. Second, they enable the detection of deviations from typical growth patterns in affected individuals and aid in early diagnosis of additional conditions. Finally, they are very useful for evaluating the effects of growth-promoting treatment among patients. At present, disease-specific growth charts are available for several syndromes, such as Prader-Willi syndrome, Down syndrome, Williams syndrome, Turner syndrome (TS), and Noonan syndrome (NS) [4-10].
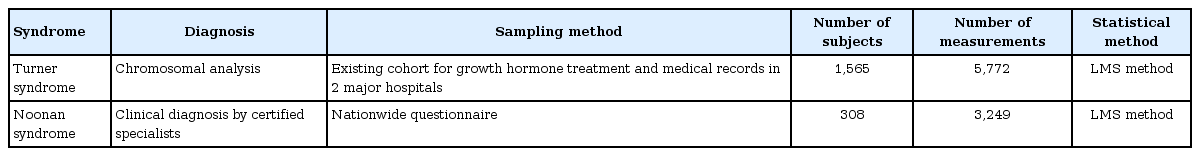
When developing disease-specific growth charts, we should consider several factors that may affect the reliability of the charts (Table 1). First, we should determine if the disease with growth failure can be precisely defined. If the pathogenesis or etiology of the disease is ambiguous, we cannot admit the significance of disease-specific growth charts. Second, we should avoid selection bias in subject measurements whenever possible. It often occurs that subjects recruited for measurements are not representative of the overall disease population, as diagnoses are usually made after many symptoms manifest. Therefore, it is possible that the sample used for measurements is biased by delayed diagnosis of the disease, and if we analyzed only cross-sectional data, the developed disease-specific growth charts may show biased and different growth patterns. This will be discussed later in the example on the development of growth charts in TS. Additional selection bias may derive from the specialties of the physicians seeing the patients, which will be discussed later in the example of the development of growth charts in NS. Briefly, in clinically heterogeneous disease such as NS where many specialists are involved in care, subject measurements should be obtained from multidisciplinary specialists. In addition, the rearing environment of the subjects may cause selection bias. Third, we should consider secular trends among subjects when gathering data. For rare diseases, it can be difficult to recruit a sufficient number of patients. Therefore, we tend to recruit subjects over many years, which can cause the developed disease-specific growth charts to be affected by secular growth trends. Fourth, we should collect measurements from a sufficient number of patients of all ages when developing disease-specific growth charts. If insufficient subjects are available in certain age categories, a bump or a dip will be observed in the growth charts, which reflects the sampling error that occurs with a small number of subjects. Fifth, we should consider that ethnicity can influence the growth of children with a disease. Finally, we should analyze precise anthropometric data using proper statistical methods. Considering all these factors, it seems almost impossible to collect ideal data to establish true disease-specific standards. However, is it necessary to do so because disease-specific growth references remain meaningful tools for physicians in various clinical settings [3]. In this review, we summarize our experiences developing disease-specific growth charts in TS [8] and NS [9,10].

Factors affecting the development of disease-specific growth charts
Development of growth charts in TS
TS is a chromosomal disorder occurring in females that is characterized by short stature and primary ovarian failure. It is the most common chromosomal disorder in females, and the incidence is estimated at 1 in 1,500–2,500 live births [11-13]. TS is defined by a karyotype that contains a cell line of monosomy lacking at least the distal major part of the short arm of one X chromosome. The growth patterns of TS girls are different from those of normal individuals [11-13]. The birth length in TS is smaller than that in normal populations due to mild growth delay in utero. After birth, the growth velocity gradually declines. The length/height of girls with TS often remains within the normal range during infancy, but usually falls below the fifth percentile of the normal population by the age of 5 years. Growth failure is more evident as girls become mature, and growth spurts are not observed during the expected pubertal period. Untreated adults with TS are reported to be approximately 20 cm shorter than normal female adults [14].
TS-specific growth charts are available in many countries [8,15-23]. In Japan, the first TS-specific growth charts were developed by Suwa [20] in 1992. These charts were constructed using data from 704 girls with TS (6,255 measurements) born from 1955 to 1989 (median unknown), meaning that most of the analyzed subjects were born in 1972 or earlier. As the secular trend of increasing height among Japanese children reached a plateau around 1990 [7], the TS-specific growth charts developed by Suwa [20] became inappropriate for the evaluation of girls recently diagnosed with TS. Thus, revisions to the charts were necessary.
For the development of revised TS-specific growth charts, we utilized a database from the Foundation for Growth Science [24]. This database controls for the use of growth hormone (GH) through its registration system and contains pretreatment data for TS patients across Japan. After data cleaning and analyzing pretreatment data for girls with TS born in 1970 or later, cross-sectional growth charts were constructed [7]. However, there was a problem that the growth charts were shifted downward in younger ages, which seemed to be due to selection bias. Girls with TS who registered with the Foundation during infancy tended to be smaller than those who registered beyond infancy, because the degree of height difference between girls with TS and the normal population was smaller in infancy. On the other hand, girls with TS who registered at older ages might not have been affected by this selection bias because the height difference between the 2 populations was much greater [25]. In brief, taller TS patients are often diagnosed only in older ages. To solve this problem, data for relatively tall TS girls during infancy was needed. To address this issue, we utilized semilongitudinal data for girls with TS diagnosed at older ages. As the Foundation database only included 3 consecutive years of data prior to GH treatment, we could not obtain enough data from this source. Therefore, we collected new longitudinal data from the medical records of 205 girls with TS who sought treatment at 2 major hospitals in Tokyo (the National Center for Child Health and Development and Toranomon Hospital) and used these data for the revision of the growth charts. From the 2 datasets, 2,072 subjects (born from 1970 to 2006, median 1985) were available. After excluding individuals who lacked the typical TS karyotype (n=31), those with spontaneous puberty (n=144), unknown puberty at the time of height and weight measurement (n=14), a history of growth-promoting treatment (n=264), measured values exceeding ±5 standard deviation (SD) in the study population (n=4), and duplicate registration (n=50), 1,565 subjects were retained for analysis. The presence of puberty was judged by statements in the application form (for Foundation data) or the attainment of Tanner 2 breast development (for hospital data). Of the 5,796 measurements from 1,565 subjects before growth-promoting treatment, an additional 24 measurements were excluded because they fell outside the range of ±5 SD of the population mean. New TS-specific growth charts were then constructed from the remaining 5,772 measurements using LMS Chartmaker Pro ver. 2.3 (Medical Research Council, London, UK).
Based on the new TS-specific growth chart, the mean height of an adult female with TS is 141.3±5.6 cm, which is comparable to data from other Japanese TS samples (e.g., 143.0±4.9 cm, 18 TS females without GH treatment) [26]. According to the chart, individuals with TS at the age of 20 years are, on average, -3.30 SD below the mean height for the normal population, which is similar to data from foreign countries (-2.54 to -4.15 SD) [14]. These findings support the validity of the new TS-specific growth chart.
Girls with TS with spontaneous puberty are significantly taller than those without spontaneous puberty at the age of ≥12 years, but the difference is no longer significant when they reach their adult height [22]. Thus, 2 types of growth charts may be necessary during the peripubertal period. However, we only produced TS-specific growth charts for girls without spontaneous puberty due to the limited number of pubertal subjects. Nevertheless, when we plotted the measurements from 144 subjects with spontaneous puberty on the new charts, all except for 5 measurements were distributed within ±2 SD. This finding suggests that the new TS-specific growth charts can be used for girls with TS with spontaneous puberty.
Through these processes, new TS-specific growth charts for Japanese girls were constructed [8]. We believe that the new TS-specific charts can be presumed to be representative of growth in girls with TS who are ordinarily seen in clinical practices. In addition, these charts are the only TS-specific growth charts based on an Asian population.
Development of growth charts in NS
NS is a clinically and genetically heterogeneous syndrome with an estimated incidence of between 1 in 1,000 to 1 in 2,500 live births [27-29]. The cardinal features of NS are distinctive facial characteristics that change with age, short stature, congenital heart disease, and chest deformity [27,30]. Clinical features of NS can vary within a family, but become more subtle in adult life [31]. Individuals with NS are typically treated by a multidisciplinary team of specialists, which includes pediatric geneticists, pediatric cardiologists, and pediatric endocrinologists.
The Ras/mitogen-activated protein kinase (MAPK) signaling pathway is an essential signaling pathway that controls cell proliferation, differentiation, and survival. The protein-tyrosine phosphatase, nonreceptor type 11 (PTPN11) gene, which encodes a tyrosine phosphatase protein involved in the Ras/MAPK signaling pathway, was identified as the first causative gene in NS patients [32]. Increasing evidence indicates that germline mutations in genes involved in the Ras/MAPK signaling pathway cause NS and Noonan-related syndrome [33]. While mutations in such genes have been identified in approximately 60%–70% of patients with NS [34,35], the diagnosis of NS remains clinical [27,36]. Several scoring systems are currently available for diagnosis, with the scoring system developed by van der Burgt et al. [37] in 1994 being the most widely used.
Growth patterns of children with NS are different from those of the normal population. The mean birth length is slightly shorter, but within the normal range. However, a rapid decline in length/height SD score (SDS) relative to the normal population develops during the first year of life. Thereafter, mean length/height lies approximately on the -2.5 SD line for the normal population until age 12 years in boys and 10.5 years in girls. Afterwards, further decline becomes obvious due to delayed puberty, and then the height SDS relative to the normal population tends to recover.
NS-specific growth curves are currently available for 4 regions: Brazil, Europe, North America, and Japan [9,10,38-40]. Undoubtedly, NS-specific charts should be developed with data collected by multidisciplinary specialists. Therefore, when we constructed NS-specific growth charts [9,10], we conducted a nationwide survey of pediatric geneticists, pediatric cardiologists, and pediatric endocrinologists responsible for Japanese NS patients. We collaborated with three academic societies (i.e., The Japan Society of Pediatric Genetics, The Japanese Society of Pediatric Cardiology and Cardiac Surgery, and The Japanese Society for Pediatric Endocrinology) and gathered data for NS patients diagnosed by specialists from these societies at 31 hospitals nationwide. Due to secular trends in height, we recruited patients born in 1970 or later [7]. Questionnaires that included auxological measurements together with a minimal set of clinical and genetic data were sent to these hospitals. Height and weight measurements were gathered in a mixed longitudinal and cross-sectional manner. The minimal interval between 2 measurements was 1 month when the subjects were measured before 1 year of age or 3 months when measured after 1 year of age.
Twenty of the 31 hospitals responded to our questionnaire, resulting in data for 356 clinically diagnosed NS patients. A total of 48 subjects were excluded because of missing auxological data (n=26), presence of complications that might have affected growth (n=5), or extreme longitudinal growth aberrations ±3 SD from the mean (n=17). The remaining 308 subjects (159 boys, 149 girls) were analyzed. To develop the growth charts, 3,249 measurements (boys, 1,674; girls, 1,575) were included after exclusion of 23 measurements from three outliers. Height SDSs were not significantly different between individuals with and without genetic analysis (difference, 0.076; 95% confidence interval [CI], -0.020 to 0.17; P=0.12). NS-specific growth charts were constructed using LMS Chartmaker Pro ver. 2.3 (Medical Research Council, London, UK).
Subjects were diagnosed with NS by certified specialists, and thus, diagnoses were very reliable. Moreover, diagnosis was further validated by the scoring system developed by van der Burgt et al. [37. All measurements were properly selected by excluding individuals with previous growth-promoting treatment, complications that may affect growth, and extreme longitudinal growth aberrations. Based on the NS-specific growth charts, adult height is 157.3±7.4 cm for males (-2.3±1.3 SDS) and 146.8±6.9 cm for females (-2.1±1.3 SDS). These adult height SDSs for the normal population are comparable to values reported in other countries (male, -2.5 to -1.4; female, -2.2 to -1.8) [38-42].
Through these processes, NS-specific growth charts for Japanese individuals were constructed [9,10]. We believe that these charts can be presumed to be representative of growth in individuals with NS who are ordinarily seen in clinical practice. Moreover, these are the only NS-specific growth charts based on measurements from an Asian population.
Statistical method used for developing growth charts
The lambda-mu-sigma (LMS) method [43] was used for the development of disease-specific growth charts for Japanese individuals with TS and NS. The LMS method is a standard method for establishing growth charts [44] and is effective at constructing reference charts that show the distribution of a measurement as it changes by covariates such as age and time. The LMS method includes smoothing with a spline function after normalizing age-specific data using a power transformation. In this method, the degree of skewness (L), median (M), and coefficient of variation (S) are estimated by age, and SD scores (Z-scores) of each index can be calculated from the L, M, and S values. This method also allows the calculation of percentiles, as SD scores can be converted to percentiles in a normal distribution. The LMS method is usually used for establishing growth charts based on cross-sectional data. However, it can also be used for establishing growth charts based on longitudinal data when the measurements are widely scattered and there are no subjects with a nonnegligible influence on the charts [9,45]. In the data used for development of disease-specific growth charts for Japanese individuals with TS and NS, numerous measurements were scattered across the age range and all subjects had a significant influence on the growth charts.
Discussion
When developing disease-specific growth charts, it is essential to collect anthropometric measurements that reflect the true disease population. Therefore, we made maximal efforts to obtain unbiased data for subjects with TS and NS that were representative of overall TS and NS populations in Japan. Table 2 summarizes the characteristics considered in the development of disease-specific growth charts for Japanese individuals with TS and NS. For TS, we first utilized an existing nationwide cohort of TS patients before GH treatment in Japan. However, this cohort did not represent the true population of TS due to diagnosis bias. To overcome this significant selection bias, we compiled new hospital data in addition to the cohort data and analyzed both cross-sectional and longitudinal datasets. These efforts have made the TS-specific charts closer to the true TS standards. For NS, there was not an existing cohort with anthropometric data. Therefore, we conducted a nationwide questionnaire survey of multidisciplinary specialists, as NS is a clinically and genetically heterogeneous syndrome. As diagnosis of NS can be difficult, it was essential to have reliable diagnoses. To do so, we only compiled data for subjects diagnosed by certified specialists and validated the diagnosis using the scoring system developed by van der Burgt et al. [37]. Although these efforts may not be perfect, we believe that the collected measurements are sufficient for developing NS-specific growth charts.
Characteristics in the development of disease-specific growth charts for Japanese individuals with Turner syndrome or Noonan syndrome
Ethnic background may affect growth in individuals with TS or NS. As the population of Japan is generally considered ethnically homogeneous, we did not need to consider ethnicity when developing disease-specific growth charts. Theoretically, local TS and NS-specific growth charts would be most suitable for individual growth monitoring in different countries. However, developing these charts can be difficult. It is of note that there are no other disease-specific growth charts in TS and NS for Asian populations except for our charts. If our charts are used for other Asian populations, physicians should bear in mind how growth patterns in their countries differ from those in Japanese. For example, if our charts were utilized by Korean physicians, they should know the difference in growth patterns between the two countries. Fig. 1 shows growth charts of the normal Japanese population [46] superimposed on the normal Korean population [47]. As the figure shows, there is considerable overlap except for younger and pubertal ages. Therefore, our TS and NS-specific growth charts might be applicable as long as physicians are aware of the different growth patterns between two countries in the general population.
Conclusions
Disease-specific growth charts are very useful tools. Theoretically, these charts should be constructed for each ethnic group. However, gathering unbiased subject measurements is very challenging. Here, we reviewed the development of disease-specific charts for Japanese individuals with TS and NS. When using disease-specific charts developed using data from other ethnic groups, physicians should consider the underlying differences in normal growth patterns between ethnic groups.
Notes
Conflict of interest: No potential conflict of interest relevant to this article was reported.