North Korean children: nutrition and growth
Article information

Abstract
North Korea suffered from severe famine in the mid-1990s; this impacted many areas, including people's transnational movement, child growth, and mortality. This review carefully examined nutritional status trends of children in North Korea using published reports from national nutrition assessment surveys. Nutritional adaptation of North Korean child refugees living in South Korea was also studied with their growth and food consumption, using published researches. The nutritional status of children in North Korea has recovered to a “low” level acute malnutrition status and a "medium" level chronic malnutrition status. Large disparities by geographic region still remain. North Korean child refugees in South Korea were significantly shorter and lighter than their age- and sex-matched South Korean counterparts (P<0.05); however, North Korean child refugees were catching up, and weight was improving faster than height. Linear growth retarded (height for age Z-score < -1) North Korean children showed a significantly higher respiratory quotient than nonlinear growth retarded children, indicating metabolic adaptation responding to the food shortage. These changes, accompanied by abundant access to food in South Korea, have led to the elimination of significant differences in the obesity ratio between North Korean and South Korean children living in South Korea after approximately 2 years of residency. This nutritional adaptation may not be beneficial to North Korean child refugees, especially given the prediction of Barker’s theory. The lack of studies prevented a better understanding of this issue; therefore, large cohort studies, preferably with random sampling strategies, are needed to further understand this issue and to design appropriate interventions.
Introduction
North Korea is one of only a few communist countries in the world. The basic public health indicators (Table 1) show that North Korea built fair public health infrastructure back in the 1970s and 1980s when the country was experiencing better days. However, because of the recent challenges North Korea has faced such as economic hardship and food shortage, implementation and operation of programs has been difficult. North Korea suffered a severe food shortage during the 1990s. Two of the main causes of the food shortage were yearly natural disasters such as flood or drought and the fall of the Soviet economic system. The mountainous terrain of North Korea has made adequate food production difficult, but the natural disasters during the 1990s were particularly damaging to food production because the frequent occurrences did not allow time for recovery. Moreover, the Soviet economic system fell apart, impacting North Korea’s economy. The country's economic struggles and the disappearance of its trade partners prevented the food deficits from being supplemented with imported foods. The food deficits were large enough to lead the nation into severe famine, which swept the globe as headline news [1,2].

Social and health indicators of North Korea
The famine affected most North Koreans, and it was severe enough to force the North Korean government to call for international help. Thus, many United Nations (UN) agencies, such as the United Nations Children's Fund (UNICEF) and the World Food Program (WFP), as well as international nongovernmental organizations (NGOs), were allowed to open offices in Pyongyang to respond to the immediate emergency. After 2000, the situation appeared to improve so that support for North Korea was discussed to shift to development responses away from emergency responses, however, another round of natural disasters has halted that transition1). Currently, the situation in North Korea is still very fragile. Children were the group most affected by food shortages because they are more vulnerable to environmental changes than adults. At one point, North Korea was ranked No. 1 in child malnutrition [3]. This paper reviews the situation of child malnutrition during the North Korean food shortage period of the mid-1990s and discusses its scientific and political implications.
The severe famine created a heavy flow of North Koreans leaving their country in search of food and safety. Many North Koreans chose to settle in South Korea as refugees or, more rarely, as immigrants. Immigrant or refugee populations are often studied to examine how biology, nutrition, and environment interact as a natural experiment [4]. In particular, the population of North Korean refugees in South Korea is important because North Koreans share an almost same genetic background with South Koreans, allowing better examination of the interactions between nutrition and environments. In addition, learning how North Korean refugees adapt to the new society of South Korea is helpful in preparation for possible reunification.
This review will carefully examine 2 issues: (1) the nutritional status trends of North Korean children and (2) the nutritional adaptation of North Korean child refugees in South Korea. The need for further research and policy implications will also be discussed.
Nutritional status of North Korean children in North Korea
1. Nutritional indicators
Malnutrition includes both undernutrition and overnutrition, but the term is often used to refer to undernutrition. In this review, malnutrition indicates undernutrition, unless indicated otherwise. The malnutrition status of children is assessed using 2 major categories: macronutrient status and micronutrient status (Table 2) [5]. Macronutrient status is examined in terms of energy and protein intake. Inadequate energy and protein intake results in retarded growth. When energy and protein intake is inadequate for a short period of time, children’s weight is primarily affected. This acute malnutrition is called wasting, and it is defined as a weight-for-height Z-score of less than -2. The severity of wasting is classified at 3 levels, and the most severe level, severe acute malnutrition (SAM)/severe wasting, is closely linked to child mortality. Long-term inadequate food intake often results in short stature, which is called stunting. The technical definition of stunting is a height-for-age Z-score of less than -2. A height-for-age Z-score of less than -3 is defined as severe stunting [5]. Stunting is considered important because it has been shown to be closely related with meaningful indicators, such as overall development in children, adult health, and adult productivity [6,7]. The prevalence of stunting and wasting can be used to determine the malnutrition level at the population level (Table 3) [8].

Definition of malnutrition: 2 major categories

Epidemiological cutoffs for severity of undernutrition in populations
The importance of micronutrients has become more significant in recent years [9]. Micronutrients, such as iron, vitamin A, iodine, and zinc, are routinely assessed at the population level. These micronutrients have been proven to be associated with morbidity, mortality, mental development, and quality of life (Table 2).
2. Nutrition surveys
This review used published data from 6 nutrition surveys conducted in North Korea (Table 4). The surveys were conducted through collaborative efforts between the North Korean government and UN agencies, such as UNICEF and WFP. The surveys were conducted approximately every 2 years from 1998 to 2012. The geographic areas covered in each survey differed, but the similar stratified, 2-stage cluster sampling strategies that were used in all the surveys provide some level of assurance in representativeness. Despite repeated requests for a new nutrition survey in North Korea, no survey has been conducted since 2012. The reports were published, and they are available online [10-18].
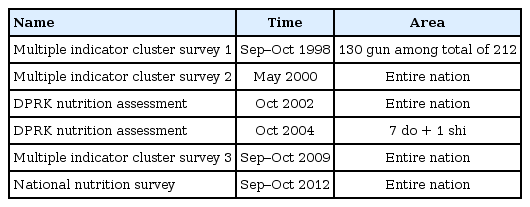
History of nutrition assessment surveys
3. Trends of nutritional status
Acute malnutrition among North Korean children has improved, as evidenced by the downward trend in the prevalence of wasting and severe wasting (Fig. 1). In 1998, the prevalence of global acute malnutrition (wasting) was 15.6%, which met the UN classification of a "very high" level necessitating immediate emergency responses, as shown in Table 3. However, the level of wasting has decreased to 4%, which meets the UN classification of “low” level. Therefore, acute malnutrition from severe food shortages might not be the current situation in North Korea.
Trends of acute malnutrition (%) among North Korean children by year.
The trend for chronic malnutrition was similar to that for acute malnutrition (Fig. 2). In 1998, 2 out of 3 children (62.3%) were stunted; in 2012, less than 1 out of 3 children (27.9%) were stunted. While the severity of chronic malnutrition by stunting has decreased, it was still at a "medium" level in 2012, which is more serious than the severity of acute malnutrition.
Trends of chronic malnutrition among North Korean children by year.
These trends indicate that the food shortage situations in North Korea have improved; however, chronic malnutrition continues to be an issue. In addition, the issue of disparity should not be overlooked or disregarded. While gender disparity in nutritional status was not significant, geographic region was a significant disparity indicator. North Korea’s northern provinces primarily showed significantly worse nutritional status than its southern provinces. For instance, while the prevalence of wasting and stunting in Pyongyang in 2012 were 2.3% and 19.6%, respectively, the prevalence in Ryanggang Province was 6.1% and 39.6%, respectively. The difference was statistically significant at P<0.05. That is, while Pyongyang could be considered to have a "low" level status for both wasting and stunting, Ryanggang Province continued to be classified as having a "medium" level status for wasting and a "high" level status for stunting. Age is another important disparity indicator (Fig. 3). Stunting and wasting had a "low" level status when children ranged in age from 0 to 5 months. As the children grew up, the stunting (global chronic malnutrition) level increased significantly, while the wasting (global acute malnutrition) level did not change significantly. The prevalence of stunting started to increase when complementary feeding started around 6 months of age, and it reached a plateau after 24 months of age. These disparities continued to be seen in all of the surveys. That is, while the overall situation of malnutrition among children in North Korea appears to have improved since 1998, the disparities by geographic region and age continue to be significant [12-13,15-17].
Percentage of acute and chronic malnutrition among North Korean children by age in 2012.
4. Comparison with South Korean children
Schwekendiek and Pak [19] compared height, weight, and body mass index (BMI) between North and South Korean children using the previously mentioned surveys (1998 and 2002) with North Korea and South Korean standards of closely corresponding years. They found that North Korean children were shorter (by 6–7 cm) and they weighed less (by 3 kg) than South Korean children in 1998. The gap was somewhat persistent in 2002, with a height difference of 8 cm and a weight difference of 3 kg. The BMI difference was approximately 1.
Shim et al. [20] reported malnutrition status differences between North and South children aged five or under using the 2004 Nutrition Survey in North Korea and South Korea Growth Curve [21]. Comparisons were conducted using 5-month age intervals. Throughout the age categories, the prevalence of stunting was higher among North Korean children; it was found in approximately 20% of children under the age of 12 months with the highest prevalence exceeding 50% in children in the older age categories between 12 and 71 months. South Korean data showed the prevalence of stunting at the level of 3%–10% for all age categories.
These results confirm that the impact of food shortage on growth is significant among North Korean children. Although North and South Korean children share similar genetic backgrounds, the differences in growth between them, assessed by height and weight, was large and significant.
North Korean child refugees in South Korea
As of mid-2017, a total of 30,805 North Korean refugees is estimated to reside in South Korea. The number of North Koreans coming to South Korea was the largest between 2006 and 2011. Since 2012, approximately 1,500 North Korean refugees have entered South Korea each year [22]. North Korean refugees receive special legal status different from immigrants or other refugees. North Korean refugees are supported with a sum of settlement monies, and they are provided with a residence, job training, health insurance, education incentives, and access to professionals that specialize in helping North Korean refugees [23]. They are also required to spend 3 months in Hanawon, a government-run facility for new North Korean refugees, before entering South Korea society to prepare them for lifestyles and environments that are different from what they experienced in North Korea.
North Korean children have also come to South Korea along with their parents or family. Approximately 5,000 North Korean refugees entered South Korea when they were under the age 20. This population is meaningful because they spent the early stage of their life in North Korea with few resources, and they are now living in a society with affluent resources. That is, they are an excellent natural experimental population for researchers to study the theory of the developmental origins of health and diseases [4].
1. Growth
A few studies [24-27] have examined the growth of North Korean child refugees living in South Korea (Table 5). These studies mostly employed a convenience sampling method rather than a random sampling method because of limited access to the list of North Korean child refugees in South Korea for security reasons. The sample size of the studies was relatively small; however, the results were significant. This demonstrates that the difference between North Korean child refugees and South Korean children was large and consistent enough to be found significant using the small sample sizes. The exception was the Pak study [27], which had a sample size of 1,406 children. That study analyzed height and weight data obtained from the physical check-ups of all children who entered Hanawon from 1995 to 2007.
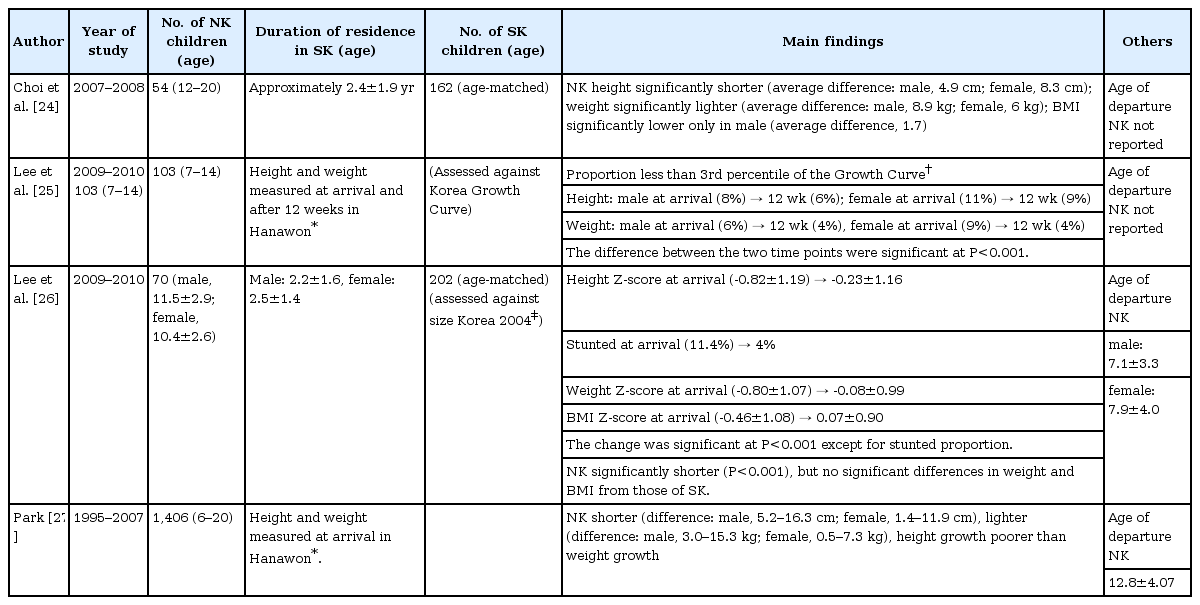
Summary of North Korean (NK) child refugee growth studies
The studies reported several common findings. All of the studies found that North Korean child refugees were shorter than their South Korean counterparts. The magnitude of the difference varies depending on age and sex. In particular, Pak [27] showed that North Korean children who were born between 1995 and 1999, when the food shortage was most dire, were shorter than those who were born before or after that period, albeit the difference was not significant in multiple regression analysis. In contrast to the consistent height differences, the results for weight differences between North Korean child refugees and age- and sex-matched South Korean children were mixed. Choi et al. [24] reported that both North Korean boys and girls weighed significantly less than their South Korean counterparts. However, Lee et al. [26] found no significant differences in weight among the girls from both countries.
Two studies [25,26] showed that the growth status of North Korean child refugees improved the longer the children lived in South Korea. Lee et al. [25] reported that the proportion of North Korean child refugees whose height and weight percentile fell under three percentile of the Korean growth curve significantly decreased during the short period of 12 weeks in which they were in Hanawon (P<0.001). Another study [26] also reported that height and weight status of North Korean child refugees significantly improved after approximately 2 years of living in South Korea (P<0.001). Average weight Z-scores among North Korean child refugees were close to zero and were not significantly different from the average weight Z-scores among South Korean children (P=0.05), while the average height Z-scores remained significantly lower in the North Korean child refugees (P<0.001). That height growth was poorer than weight growth among North Korean child refugees was also reported by Pak [27].
This unequal growth catch-up between height and weight appears to have presented a health challenge: obesity. Differences in BMI were more notable in boys. Choi et al. [24] reported that the average BMI of North Korean child refugees was significantly lower than that of South Korean children. Pak [27] also showed that BMI difference was generally larger across age between South and North Korean boys than between South and North Korean girls. Lee et al. [26] found no significant differences in BMI.
In addition to the unequal growth catch-up, metabolic adaptation might have affected the increased prevalence of obesity among North Korean child refugees. North Korean child refugees whose height Z-score was lower than -1 had a significantly higher respiratory quotient (RQ) than those whose height Z-score was -1 or higher [28]. This significant difference remained in multiple regression analysis (P=0.016). This indicates that children with linear growth retardation may favorably utilize carbohydrates more than fat, allowing fat accumulation in the body.
2. Food consumption
Only 2 studies [24,29] examined food consumption among North Korean child refugees. Since North and South Korea share the same cultural background, in general, the diet and food consumption patterns are similar in both countries. The 2 studies reported similar findings, although they used different dietary assessment methods. North Korean child refugees consumed a significantly less amount of food than age- and sex-matched South Korean children (P<0.05). Consequently, the energy and nutrient consumption status was also lower among the North Korean child refugees than their South Korean counterparts; they were also lower than the recommendations found in the Dietary Reference Intakes for Koreans (KDRIs) [30]. However, the nutrient density per 1,000 kcal was similar or higher in the North Korean child refugees. School lunch was an important source of good meals and balanced nutrient consumption for North Korean child refugees [29].
The dietary pattern of North Korean child refugees was significantly more irregular with higher rates for skipping breakfast and dinner (37.0% and 11.1%, respectively) than South Korean children (11.0% and 2.2%, respectively). More North Korean child refugees ate meals without family members (P<0.05). North Korean child refugees reported low consumption frequency of nontraditional foods, such as Ramyen, ham/sausage, yogurt, and soda. In particular, approximately half of the North Korean child refugee participants reported rarely eating candy, pizza, hamburgers, or bread [29].
Discussion and conclusion
The nutritional status of children in North Korea is widely believed to have recovered from the disastrous status during the 1990s famine to achieve a "low" acute malnutrition status and a "medium" chronic malnutrition status with a significant level of disparity based on geographic regions and age. North Korean child refugees in South Korea were significantly shorter and they weighed less than their South Korean counterparts. As the time in which they lived in South Korea increased, the height and weight gap between North and South Korean children appeared to have narrowed, with the weight gap narrowing faster. The obesity rate of North Korean child refugees seems to be catching up to that of South Korean children.
The recovery of nutritional status among children in North Korea has contributed to better food production and food aid through UN agencies and NGOs [1,2]. Despite the trend of recovery, it is important to remember that the situation in North Korea is still somewhat vulnerable to changes in food production and the country's sociopolitical situation. The large proportion (27.9%) of children assessed to be stunted (chronically malnourished) is a concern. Stunting has been proven to be associated with negative impacts on health and adulthood productivity. Stunting after the first 2 years of life is believed to cause irreversible damage into adult life [6]. That is, the still high prevalence of stunting could lead to a significant proportion of the population being at higher risk of chronic diseases, such as cardiovascular diseases, diabetes, or certain types of cancer [4,31]. This possibility was supported by the higher RQ among children with linear growth retardation [28].
Finding the best way to escape from undernutrition without increasing the risk of overnutrition in later life is one of the important and pressing questions many researchers and practitioners have been attempting to answer in a world with a double burden of malnutrition [32]. The few proven facts have shown that interventions during the first 2 years of life do not increase chronic disease risk and that stunting after 24 months of age is not reversible [6]; this has led to the "One thousand days" global initiative [33]. Therefore, we should continue to endeavor to provide essential nutrition interventions [34] to North Korean children who are under 2 years of age. Essential nutrition interventions have been recommended after careful examination by international committees [35,36]. Some of the examples include iron folate supplementation for pregnant women, the promotion of breastfeeding, vitamin A fortification or supplementation, and treatment of SAM. Most of the interventions have been carried out in North Korea by UN agencies and NGOs; however, the scale of the interventions may not have been large enough to have had a meaningful impact. Access to the northern areas of North Korea, such as Ryangangdo, is very limited, and the malnutrition level has been repeatedly reported to be the highest in that region. This is concerning because few nutrition interventions have been provided to residents in the country's northern areas. Another concern is the routine use of supplementary foods, such as PlumpyNut (Nutriset, Malaunay, France), to treat children with moderate acute malnutrition (wasting). The most recent guideline does not recommend routine use of supplementary foods in places without a substantial food shortage because of the concerns that doing so will increase the risk of obesity and other chronic diseases such as diabetes [37]. Although the guideline leaves much of the decision-making details to field workers, this recommendation should be implemented in North Korea where applicable.
North Korean child refugees are the best population that can teach us the most effective way to recover from undernutrition without increasing chronic disease risks. The children are now living in a society where food is available, diverse, and plentiful; this puts the children at a higher risk of developing obesity because they now live in an obesogenic environment [38]. Several interventions targeting this population are available, but only a few have focused on nutrition and health issues. For instance, after-school activities for North Korean child refugees provide them with help on school work and adjusting to living in South Korea. These activities often include a meal, most often dinner. Many of the organizations running these activities provide food with low nutritional value, such as pizza, hamburgers, or fried chicken, because these foods are convenient and/or the organizations often do not have access to a kitchen to prepare and serve healthier alternatives. The dilemma of nutritionists is whether to recommend that those foods with high energy and low nutrients not be provided to North Korean child refugees. Considering the concern of the increasing risk of obesity and chronic diseases, limiting the consumption of this type of food during these activities seems reasonable. However, oftentimes, these activities are the only outlet for North Korean child refugees to be exposed to food that they do not get to eat at home. As previously discussed, Lee and Nam [29] reported on the low level of consumption of such foods. Learning about new types of food would be important to the social life of North Korean child refugees, and it is part of their adaptation into a new society.
Another question is whether a nutrition intervention specific for North Korean child refugees would be needed as opposed to general nutrition interventions targeting that age group. School lunch programs provide a nutritionally balanced meal to students, and North Korean child refugees attending school benefit from this. Although North Korean child refugees are shorter and they weigh less than their South Korean counterparts, their nutritional problems are not very different. That is, all children should learn to eat a balanced meal with high nutrient-rich foods. North Korean child refugees may benefit more from learning how to choose the best high nutrient-rich foods [29]. In turn, these efforts will help reduce their risk of becoming obese.
The nutrition surveys in North Korea did not find a disparity in nutritional status based on gender; however, gender disparity might be evidenced in the North Korean child refugees’ adaptation to South Korea because boys seem to gain weight faster than girls [24]. This phenomena has also been found in the adaptation process among Korean Americans [39]. Girls may be more attentive to weight and body image, so they do not gain as much weight as boys. Therefore, boys could be at higher risk for obesity, heart disease, and other chronic diseases if they continue to gain weight without proper weight management. A population-level obesity prevention intervention specific for North Korean child refugees would probably be uncalled for; however, the growth patterns of North Korean child refugees should be monitored. North Korean adult refugees have been reported to develop metabolic syndrome to a more significant degree if they gain weight [40]. Monitoring North Korean child refugees would provide evidence for when to begin a population-level intervention and for understanding the relationship between environment and health.
This review is limited by the quality of the data. The nutrition surveys in North Korea were conducted under certain constraints, although technical support was provided from the World Health Organization, UNICEF, and WFP. For instance, no survey covered every region in North Korea. Moreover, studies of refugees cannot be free from self-selection error. North Korean refugee children may not be representative of North Korean children. They may be healthy enough to leave North Korean and travel to South Korea, and they may be equipped with better social skills and economic means [41]. Another limitation is the small number of studies. Although several studies have been conducted in the humanities and social sciences, only a handful of studies have examined growth, nutrition, and health. Because the population of North Korean refugees in South Korea is getting larger and older, a cohort study with a random sampling method is necessary.
This review examined the nutritional status trends of North Korean children and the nutritional adaptation of North Korean child refugees in South Korea. Cohort studies with a good study design and sampling methods are needed to understand the growth pattern, the nutritional status, and the health risk among North Korean child refugees so that they can be properly prepared for possible future reunification.
Notes
Conflict of interest: No potential conflict of interest relevant to this article was reported.