Influence of The -202 A/C insulin-like growth factor-binding protein-3 promoter polymorphism on individual variation in height in Korean girls
Article information

Abstract
Purpose
The most common single nucleotide polymorphism in the IGFBP3 promoter region occurs at position -202. This polymorphic variation occurs frequently and may influence growth hormone responsiveness and somatic growth. However, the effects of IGFBP3 promoter polymorphism on growth in children are unknown.
Methods
Restriction fragment length polymorphism-based genotyping of the -202 single nucleotide polymorphism was performed in 146 Korean girls aged between 15 and 16 years, who were selected randomly from the Seoul School Health Promotion Center. The participants were divided into 3 groups (tall, medium, and short) according to the height percentile established from normal reference values for Korean children. The serum levels of insulin-like growth factor I (IGF-I) and IGF-binding protein-3 (IGFBP-3) were then compared according to genotype.
Results
The genotype distribution in the participants was 79 AA (54.1%), 60 AC (41.1%), and 7 CC (4.8%). The C allele frequency at the -202 IGFBP3 position was 25.4% in this group. The mean serum IGFBP-3 concentration in girls with the AA genotype was higher than that in girls with the AC genotype in the medium (P=0.047) and short (P=0.035) groups, respectively. There was no difference in the IGF-I to IGFBP-3 molar ratio between the AA and AC genotype groups (P=0.161).
Conclusion
In conclusion, the -202 polymorphism in the IGFBP3 promoter region is assumed to affect the serum concentration of IGFBP-3 in children as well as in adults. However, it is unclear whether this affects physical development according to the concentration of IGFBP-3.
Introduction
Insulin-like growth factor I (IGF-I) expression is regulated by growth hormone and is essential for somatic growth in children1). Furthermore, it is known that serum levels of IGF-I and IGF-binding protein-3 (IGFBP-3) reflect spontaneous growth hormone secretion in healthy individuals2). Circulating IGF-I binds to IGFBP-3 to form a tertiary structure, while unbound, free IGF-I plays a role in target tissues. Because of the very short metabolic half-life of IGF-I, it is difficult to measure its precise serum level. Instead, the levels of free, biologically active IGF-I can be estimated by measuring the molar ratio between IGF-I and IGFBP-3, because IGFBP-3 is pivotal for circulating IGF bioactivity3). It has been speculated that higher levels of IGFBP-3 are associated with lower levels of free IGF-I in the serum, mainly because most IGF-I is bound to IGFBP-3. Five polymorphic loci are known in IGFBP345); the A allele at the -202 locus has a significantly higher promoter activity compared with that of the C allele, which is consistent with the relationship observed between genotype and circulating IGFBP-3 levels (AA > AC > CC)56). The frequency of the C allele at the -202 A/C polymorphism was 53.5% in a multiethnic population living in Canada5) and 54% in female registered nurses living in the United States7).
IGFBP-3, by binding IGF-I, regulates the serum levels of free IGF-I and maintains the reservoir of IGF-I. This factor is also related to apoptosis. High serum levels of IGFBP-3 lower the risk of cancer, such as those of the breast8), prostate9), colorectal10), and lung11); many studies of the relationship between IGFBP-3 and cancer risk are currently in progress. High serum levels of IGFBP-3 may also lead to relatively low serum levels of free IGF-I, which may cause a decreased response to growth hormone. It is unclear whether the -202 A/C polymorphism affects individual variation of normal growth in healthy children, or only abnormal growth in children with growth hormone deficiency or acromegaly. We previously reported that the frequency of the C allele at the -202 locus was 16.7% (18.4% in boys, 14.3% in girls), and that the CC genotype was absent in 33 Korean children with relatively short stature12). Here, we investigated the association between the genotype at the -202 locus and growth in normal Korean children by increasing the sample size and including taller participants, building on our previous study.
Materials and methods
1. Participants and samples
We studied girls aged between 15 and 16 years who volunteered to undergo physical examination for a population census at the Seoul School Health Center in 2001. They were divided into 3 groups by their height percentiles: short stature (3rd–10th percentile, group 1), medium stature (50th percentile, group 2), and tall stature (90th–97th percentile, group 3), according to the 2007 growth reference for Korean children and adolescents by the Korean Pediatric Society and the Korea Centers for Disease Control and Prevention13). In total, 150 girls were enrolled in this study, and each group consisted of 50 randomly selected girls. Of these, 4 girls were excluded because the genotypes could not be identified in the 3 and the serum IFG-1 level could not be determined in the remaining one. Finally, 146 girls (48 girls in group 1; 49 in group 2; and 49 in group 3) were analyzed. This study has been approved by the Institutional Review Board of Hallym University Kangdong Sacred Heart Hospital, Seoul, Korea (approval number: KANGDONG 2015-03-012).
2. Measurement of serum IGF-I and IGFBP-3 levels and extraction of DNA
Blood samples (1 mL of whole blood and 2 mL of serum) were obtained from each participant and were immediately stored at −20℃ until required for bioassays. Serum levels of IGF-I and IGFBP-3 were measured using an IRMA kit (DSL Inc., Webster, TX, USA), and genomic DNA was extracted from whole blood using a Wizard DNA Purification Kit (Promega, Madison, WI, USA) and stored at −20℃ until required for analysis.
3. PCR of IGFBP3 promoter region
About 100 ng of genomic DNA was mixed with polymerase chain reaction (PCR) buffer, containing 1 µmol/L of sense primer, 1 µmol/L of antisense primer, 0.25 mmol/L of deoxy-NTP, 1.25 U h-Taq DNA polymerase (SolGent, Seoul, Korea) and 5 × Band Doctor (SolGent), and distilled water, to a total volume of 50 µL. The PCR cycling parameters consisted of an initial incubation of 15 minutes at 95℃, followed by 35 cycles each consisting of 1 minute at 94℃, 1 minute at 64℃, and 1 minute at 72℃. The reaction was terminated after a final extension of 10 minutes at 72℃. The sense and antisense primer sequences were 5′-CCA CGA GGT ACA CAC GAA TG-3′ and 5′-AGC CGC AGT GCT CGC ATC TGG-3′, respectively5). Five microliters of PCR products were subsequently visualized on a 2% agarose gel stained with ethidium bromide.
4. RFLP genotyping of the -202 locus
After PCR, restriction fragment length polymorphism (RFLP) analysis was performed on the fragment to determine the genotype at the -202 IGFBP3 locus, as described in our previous study12). Ten microliters of the PCR product were digested with 2.5 U Alw21I (MBI Fermentas, Flamborough, Canada), for 10–13 hours at 37℃, and samples were then incubated for 20 minutes at 65℃ to inactivate the enzyme. Five microliters of the digestion product were visualized on a 2% agarose gel stained with ethidium bromide. Due to the presence of three Alw21I sites in the PCR product, one of which is destroyed by the presence of a C at the -202 locus, band sizes were 242 and 162 bp (A allele), and 288 and 162 bp (C allele) (Fig. 1).
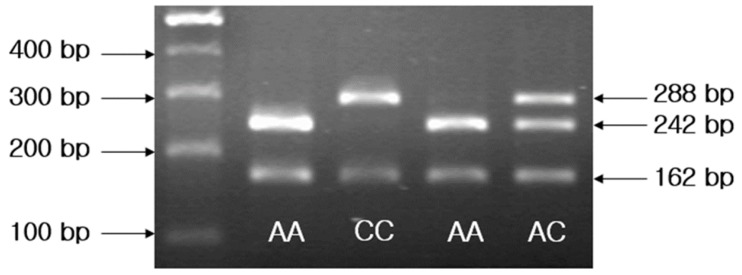
A representative pattern of restriction fragment length polymorphism analysis on a gel indicates different genotypes in 4 individuals. A size marker (100-bp DNA ladder) is included in the far left lane.
5. Statistical analysis
In order to compare serum IGF-I and IGFBP-3 levels and the IGF-I/IGFBP-3 molar ratio according to genotype, an independent sample t-test and one-way analysis of variance were used. The chi-square test was used to compare the frequency of the genotypes. The data were analyzed using IBM SPSS Statistics ver. 19.0 (IBM Co., Armonk, NY, USA). A P-value <0.05 was used as the cutoff for statistical significance.
Results
1. Distribution of genotypes and the frequency of alleles
Among the 146 girls analyzed, the AA genotype was found in 79 girls (54.1%), the AC genotype in 60 girls (41.1%), and the CC genotype in 7 girls (4.8%). In group 1 (n=48), there were 29 AA (60.4%), 17 AC (35.4%), and 2 CC genotypes (4.2%). In group 2 (n=49), 23 AA (47.0%), 25 AC (51.0%), and 1 CC genotypes (2.0%) were found. In group 3 (n=49), 27 girls had the AA (55.1%), 18 the AC (36.7%), and 4 the CC genotype (8.2%). There was no statistical difference in genotype frequency between groups. The frequency of the C allele was 25.3% (74 of 292 alleles); this included 21.9% (21 of 96 alleles) in group 1, 27.6% (27 of 98 alleles) in group 2, and 26.5% (26 of 98 alleles) in group 3. There was no statistical difference in the frequency of the C allele between groups, although the frequency of the C allele was somewhat lower in group 1.
2. Analyses according to genotype
1) Serum IGFBP-3 concentrations by genotype
The serum IGFBP-3 concentration was 6,032±642 ng/mL in the AA genotype group, 5,670±722 ng/mL in the AC genotype group, and 5,214±893 ng/mL in the CC genotype group. In the AA genotype group, this concentration was significantly higher than in the AC and CC genotype groups (both P=0.002) (Fig. 2).
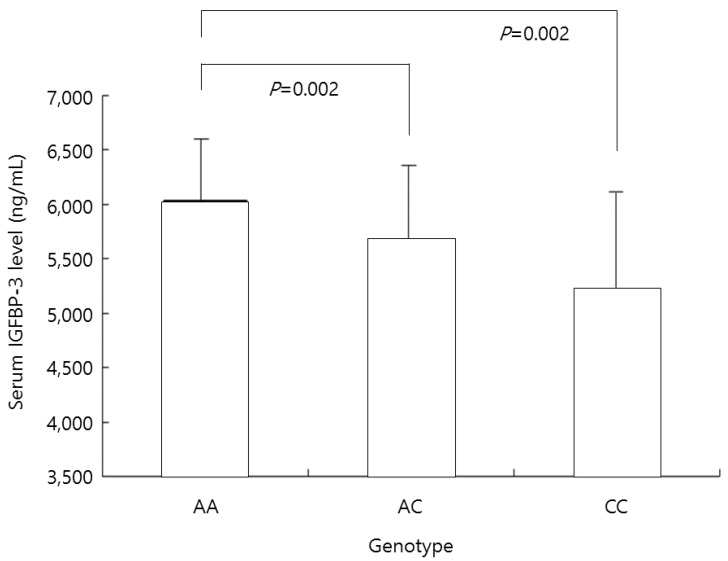
Mean insulin-like growth factor-binding protein-3 (IGFBP-3) levels in all participants according to the genotype at nucleotide -202 of IGFBP-3. In the AA genotype group, this concentration was significantly higher than in the AC and CC genotype groups (both P=0.002).
2) The ratio of IGF-I/IGFBP-3
The ratio of IGF-I/IGFBP-3 in the AA genotype group was 0.089±0.016; in the AC genotype group this ratio was 0.096±0.018, and that in the CC genotype group was 0.102±0.016, respectively. The ratio was significantly lower in the AA genotype group than in the AC genotype group (P=0.033) (Fig. 3).
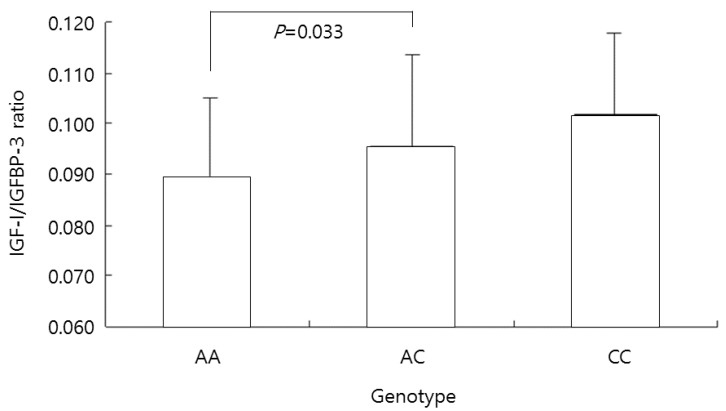
The insulin-like growth factor-1 (IGF-I)/IGF-binding protein-3 (IGFBP-3) ratio in all participants according to the genotype at the -202 A/C IGFBP3 locus. The ratio was significantly lower in the AA genotype group than in the AC genotype group (P=0.033).
3. Analyses according to genotype in each group
1) Serum IGFBP-3 concentration
The serum IGFBP-3 concentrations in each group are summarized according to the genotype at the -202 locus in Table 1. In group 1, IGFBP-3 concentrations of the AA genotype group was 5,860±596 ng/mL; in the AC genotype group, it was 5,463±594 ng/mL, and in the CC genotype group, it was 4,476±153 ng/mL. The IGFBP-3 concentration was significantly higher in the AA genotype group than in the AC genotype group (P=0.035). In group 2, the IGFBP-3 concentration of the AA genotype group was 6,079±707 ng/mL, that in the AC genotype group was 5,669±686 ng/mL, and that in the CC genotype group was 5,113±0 ng/mL, respectively. The IGFBP-3 concentration was significantly higher in the AA genotype than in the AC genotype group (P=0.047). In group 3, the IGFBP-3 concentration of the AA genotype group was 6,178±612 ng/mL; the IGFBP-3 levels in the AC genotype group was 5,867±854 ng/mL, and that in the CC genotype group was 5,609±1,006 ng/mL. IGFBP-3 levels between the AC genotype and AA genotype was not significantly different. Because the number of CC genotype was low in each group, statistical comparison between the CC genotype, AA genotype, and AC genotype was unfeasible.

IGFBP-3 levels according to group and genotype at the -202 A/C locus
2) The ratio of IGF-I/IGFBP-3
The IGF-I/IGFBP-3 ratio in each group is summarized according to the genotype at the -202 locus in Table 2. In group 1, the IGF-I/IGFBP-3 ratio of the AA genotype group was 0.085±0.015; that in the AC genotype group was 0.089±0.021, and that in the CC genotype group was 0.099±0.034. There was no significant difference in the IGF-I/IGFBP-3 ratio between the AA and AC genotype groups (P=0.461). In group 2, the IGF-I/IGFBP-3 ratio of the AA genotype group was 0.093±0.016; in the AC genotype group, it was 0.097±0.017, and in the CC genotype group, it was 0.097±0.000, respectively. There was no significant difference between the AA and AC genotype groups in terms of the IGF-I/IGFBP-3 ratio (P=0.403). In group 3, the IGF-I/IGFBP-3 ratio was 0.091±0.016, 0.100±0.017, and 0.105±0.010, in the AA, AC, and CC genotype groups, respectively. There was also no significant difference in this ratio between the AA genotype and AC genotype groups in group 3 (P=0.072). Because there were only few CC homozygotes in each group, a statistical comparison between the CC genotype and the other genotypes was not possible.

IGF-I/IGFBP-3 ratio according to group and genotype at -202 A/C locus
4. Analyses according to group (Fig. 4)

Mean levels of insulin-like growth factor-1 (IGF-I), IGF-binding protein-3 (IGFBP-3), and IGF-I/IGFBP-3 ratio were compared according to group. IGF-I concentrations in groups 2 and 3 were significantly higher than in group 1 (P=0.011 and P=0.001). The IGFBP-3 concentration was significantly higher in group 3 than in group 1 (P=0.015). The IGF-I/IGFBP-3 ratio was significantly higher in groups 2 and 3 than in group 1 (P=0.029 and P=0.020). Group 1, 3rd percentile ≤ height <10th percentile; group 2, height = 50th percentile; group 3, 90th percentile ≤ height <97th percentile.
1) Serum IGF-I concentration
The IGF-I concentration was 494±110 ng/mL in group 1, 559±133 ng/mL in group 2, and 572±112 ng/mL in group 3. IGF-I concentrations in groups 2 and 3 were significantly higher than in group 1 (P=0.011 and P=0.001). There was no significant difference in these levels between groups 2 and 3 (P=0.583).
2) Serum IGFBP-3 concentration
The IGFBP-3 concentration was 5,662±656 ng/mL in group 1, 5,850±719 ng/mL in group 2, and 6,017±749 ng/mL in group 3. The IGFBP-3 concentration was significantly higher in group 3 than in group 1 (P=0.015). There was no significant difference between groups 1 and 2, or between groups 2 and 3.
3) The ratio of IGF-I/IGFBP-3
In group 1, the IGF-I/IGFBP-3 ratio was 0.087±0.018. In group 2, this ratio was 0.094±0.016, and in group 3, it was 0.095±0.016. The IGF-I/IGFBP-3 ratio was significantly higher in groups 2 and 3 than in group 1 (P=0.029 and P=0.020). There was no significant difference between groups 2 and 3 (P=0.878).
Discussion
The CC genotype was not found in the participants of our preliminary study12). We had assumed that this was due to sampling error, but in the present study, the CC genotype was also present at a frequency of only 4.8% (7 out of 146) in the whole group. This was consistent with the results of other studies of Korean adults1415). In previous studies, the frequency of the C allele was 53.5% in US adults5), 54.0% in US women alone7), 51.5% in males and 54.7% in females from the UK16), 19.2% in Chinese women17), and 24.8% in Japanese men18). In our previous study12), the frequency of the C allele in 33 Korean children was 16.7% (boys, 18.4%; girls, 14.3%), while in this study, the frequency of the C allele was 25.4%. This indicates ethnic and racial differences, and that the frequency of the C allele was higher in white people than in East Asians. If the C allele reduces the serum concentration of IGFBP-3, it can be assumed that the serum concentration of free IGF-I can be relatively elevated in the presence of the C allele. A higher number of C alleles are likely to lead to greater stature, and may therefore be a factor affecting the height difference between white people and East Asians. There are numerous studies on the relationship between the -202 A/C promoter polymorphism in IGFBP3 and cancer risk. However, only a few studies were conducted about the relationship with childhood growth.
Expressions of IGF-I and IGFBP-3 are controlled by growth hormone and these factors are important substances for growth. In particular, because the concentration of free IGF-I is affected by the concentration of IGFBPs, including IGFBP-3, the polymorphism at position -202 of the IGFBP3 promoter, which affects the concentration of IGFBP-356), is thought to have an impact on growth. In a preliminary study, the A allele did not increase the serum concentration of IGFBP-3, compared to the C allele12). However, in this study, a higher serum concentration of IGFBP-3 was observed in medium and short stature individuals with the AA genotype compared to those with the AC genotype, as seen in previous reports5619).
In children, growth hormone has a significant impact on growth from before puberty, and drives growth with sex hormones in adolescence. In serum, about 75% of IGF is present in the form of a 150–200 kDa complex, and consists of 7.5 kDa IGF-I/IGF-II, 38–43 kDa IGFBP-3, and 80–90 kDa acid-labile subunits20). When combined with IGFBP-3, it forms a large complex, which cannot pass through the vascular endothelial barrier and it becomes a repository by which the half-life of IGF is extended21). Complexes of 40–50 kDa in size account for 20%–25% of the total IGF, and may act on the local tissue through the endothelial barrier. Serum IGFBP controls endocrinal effects by regulating the amount of activated IGF, such as 50-kDa IGF and free IGF. In local tissue, the presence of IGFBP implies that it has a local paracrine or autocrine effect on the regulation of IGF actions222324).
In this study, although we did not measure the concentration of free IGF-I, we measured this indirectly by calculating the IGF-I/IGFBP-3 ratio, and compared this in the various genotype groups. However, the ratio of IGF-I/IGFBP-3 did not differ according to genotype in any of the groups. A previous report found an association of the ratio between IGF-I and IGFBP-3, and showed that the concentration of IGFBP-3 differed significantly depending on the genotype, even though the ratio between IGF-I and IGFBP-3 was not different25). These findings are consistent with the results of our own study. These studies indicate that variation at the -202 IGFBP3 locus does not have a direct effect on the serum concentration of IGF-I and free IGF-I levels. Although it is clear that the serum concentration of IGFBP-3 is affected by the alleles of the -202 locus, it was significantly higher in the tall stature group than in the short stature group; it was also higher in the medium stature group than in short stature group, although not statistically significantly so. Considering these data, it is plausible that other factors play a greater role in the individual variation in body height. In addition, because differences in serum IGF-I concentration was seen between groups, and as the ratio of IGF-I/IGFBP-3 is more affected by IGF-I concentration, it is likely that IGF-I has a greater effect on height differences than IGFBP-3.
Until the early 1970s, according to the original somatomedin theory, which holds that growth hormone promotes IGF-I production in the liver, rather than affecting growth directly, and affects longitudinal bone growth via an endocrinal effect, was accepted as dogma26). However, from the 1980s, IGF-I was found to be produced not only in the liver, but also in many tissues2728). In the early 2000s, it was found that growth hormone is involved in the process of chondrocytes bulb (prechondrocyte) differentiation and cell division, and that IGF-I has autocrine and paracrine effects29) and IGF-I from differentiated cells or cells surrounding prechondrocytes cause expansion of clones. It is called dual effector theory30). However, IGF-I promotes longitudinal bone growth by ‘insulin-like’ anabolic actions that enhance chondrocyte hypertrophy in IGF-1-null mice, which cannot be explained only by that theory31). The source of IGF-I that promotes the thickening of chondrocytes was uncertain, but because IGF1 mRNA is expressed in the periosteum, muscle, and adipocytes, these may be a good source of the growth in bony length growth. In mice in which IGF-I production in the liver is abolished, the concentration of IGF-I in the serum was reduced by 75%. However, the reduction in serum IGF-I level had no discernible effect on postnatal body growth. This suggested that liver-derived IGF-I is the main determinant of serum IGF-I, but is not required for postnatal growth, indicating that autocrine/paracrine-produced IGF-I is more important than liver-derived IGF-I for body growth32).
Additional information of the participants' parental heights could have provided a more accurate analysis of the study but the samples were obtained from a national census study, which recorded only general physical information of the participants' heights and additional information regarding puberty, such as breast budding age, time of menarche was not reflected. As less than 5% of the participants showed CC genotypes, statistical analysis was not performed for that specific genotype, when the study population was subdivided by varying heights. As mentioned earlier, free IGF-I, IGF-I, and IGFBP-3 levels in serum cannot reflect the concentration of IGF-I and IGFBP-3 in local tissue, particularly in the growth plate. In this respect, the autocrine and paracrine effects of IGF-I from extrahepatic tissue and the measurement of its level in target tissue, particularly in the growth plate, should be studied.
In conclusion, the -202 polymorphism in the IGFBP3 promoter region is assumed to affect the serum concentration of IGFBP-3 in children as well as in adults. However, it is unclear whether it affects physical development according to the concentration of IGFBP-3. In addition, because the frequency of the C allele was shown to differ between ethnic and racial groups, further studies of the role of this polymorphism should be conducted.
Notes
Conflict of interest: No potential conflict of interest relevant to this article was reported.