Preserved C-peptide levels in overweight or obese compared with underweight children upon diagnosis of type 1 diabetes mellitus
Article information
Abstract
Purpose
We hypothesized that overweight or obese children might develop type 1 diabetes mellitus (T1DM) early despite residual beta-cell function. Factors independently associated with preservation of C-peptide level were analyzed.
Methods
We retrospectively reviewed the medical data of 135 children aged 2.1-16.5 years with autoimmune T1DM. Body mass index (BMI), pubertal stage, and glycosylated hemoglobin (HbA1c) and C-peptide levels were evaluated. Patients were assigned to underweight (22.2%), normal weight (63.7%), and overweight or obese (14.1%) groups according to their BMI.
Results
Preservation of serum C-peptide levels (≥0.6 ng/mL) was found in 43.0% of subjects. With increasing BMI, the proportions of children with preserved C-peptide levels increased from 33.3% to 41.9% to 63.2%, with marginal significance (P=0.051). Interaction analysis indicated no effect of BMI score on age at onset associated with serum C-peptide levels. The lower the C-peptide level, the younger the age of onset (P<0.001), after adjustment for BMI z-score and HbA1c level. However, no significant relationship between BMI z-score or category and onset age was evident. Upon multivariate-adjusted modeling, the odds that the C-peptide level was preserved increased by 1.2 fold (P=0.001) per year of life, by 3.1 folds (P=0.015) in children presenting without (compared to with) ketoacidosis, and by 5.0 folds (P=0.042) in overweight or obese (compared to underweight) children.
Conclusion
Overweight or obese children had slightly more residual beta-cell function than did underweight children. However, we found no evidence that obesity temporally accelerates T1DM presentation.
Introduction
Diabetes of type 1 or 2 develops when insulin requirements cannot be met due to functional loss of beta cells1). Such loss in patients with type 1 diabetes mellitus (T1DM) is caused by autoimmune destruction, which can be accelerated by insulin resistance. The coexistence of autoimmunity and insulin resistance has led to the concepts of "double diabetes"2), "overload"3), or "latent autoimmune diabetes of adulthood (LADA)"4).
Although T1DM patients are generally thought to be completely insulin deficient, some patients exhibit residual beta-cell function. The extent of such function and the rate of betacell loss vary among patients. Excess weight may accelerate T1DM onset and subsequent betacell loss. Thus, it is possible that excess weight might hasten the manifestations of pre-existing autoimmune beta-cell damage56).
We hypothesized that overweight or obese patients might develop T1DM earlier than others, despite the existence of residual beta-cell function. We explored whether C-peptide levels were more frequently preserved in overweight or obese T1DM patients, and if T1DM developed at a younger age in such patients. Factors independently associated with preservation of C-peptide levels were determined.
Materials and methods
1. Subjects
This study was approved by the Seoul National University Hospital Institutional Review Board (IRB No. 1502-078-649). The medical charts of 253 patients with T1DM followed-up at Seoul National University Children's Hospital between January 2005 and July 2014 were reviewed retrospectively. Insulin-dependent children with autoimmune T1DM, positive for one or more of three autoantibodies including anti-glutamic acid decarboxylase (GAD) antibody, islet-cell antibody, and insulin antibody, were included initially.
All insulin-dependent patients followed-up for ≥2 years were included. Among patients who were followed up for <2 years, those positive for two or three autoantibodies who were diagnosed before puberty and/or had low C-peptide levels were also included. In total, 118 patients were excluded because of a negative autoantibody status (n=56), missing C-peptide values and/or body mass index (BMI) data at diagnosis (n=41); it was not possible to categorize overweight or obesity in children <2 years of age due to a lack of reference data (n= 15), and in some patients with preserved C-peptide levels and short follow-up durations (n=6). Finally, 135 insulin-dependent children aged 2-18 years with autoimmune T1DM were included in the study.
2. Clinical and biochemical data
Age, sex, birth weight, height, pubertal staging, and the presence of diabetic ketoacidosis (DKA) at the time of T1DM diagnosis were recorded. Weight at discharge or at the first visit to the outpatient clinic was used to calculate BMI after recovery from hyperglycemia and/or DKA. BMI was calculated as weight (in kilograms) divided by height squared (in meters). Using the 2007 Korean National Growth Chart7), patients were categorized as underweight (<15th percentile)8), normal weight (15th to <85th percentiles), overweight (85th to <95th percentiles), or obese (≥95th percentile). Serum pH, concentrations of glucose, glycosylated hemoglobin (HbA1c), C-peptide, bicarbonate, anti-GAD antibody, islet-cell antibody, and insulin-antibody at diagnosis, and HbA1c levels during follow-up were measured. C-peptide levels are a clinically validated, well-known marker of beta-cell function9). As C-peptide was measured randomly regarding meal consumption at diagnosis of T1DM, it was considered stimulated. The preservation of C-peptide, indicating residual beta-cell function, was defined as a stimulated C-peptide level ≥0.6 ng/mL10111213).
3. Statistical analysis
All statistical analyses were conducted with IBM SPSS Statistics ver. 20.0 (IBM Co., Armonk, NY, USA). All continuous variables are described as the mean±standard deviation. Analysis of normality was firstly performed. Variables with a skewed distribution were log-transformed for further analysis. Student t test and one-way analysis of variance were used to compare the mean values of continuous variables. The chi-square test and the chi-square test for trends were used to compare categorical variables between groups. Univariate and multivariate linear regression analyses were performed to identify determinants for age at diagnosis and serum C-peptide at diagnosis, respectively. Univariate and multivariate binary logistic regression analyses were undertaken to evaluate predictors for whether or not C-peptide levels were preserved (≥0.6 ng/mL). In all analysis, the statistical significance was defined as less than 0.05 of P-values.
Results
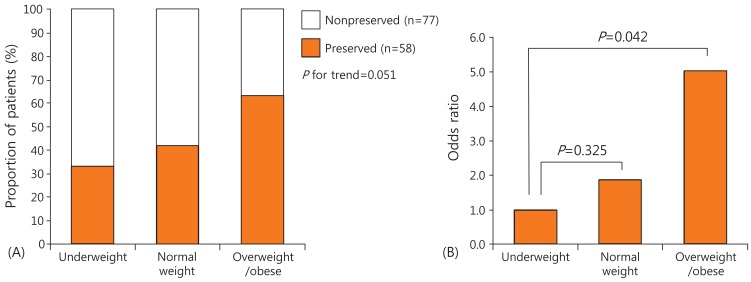
The clinical and biochemical characteristics of the 135 patients (57 males, 60 pubertal) are shown in Table 1. The mean age at diagnosis was 9.1 years (2.1-16.5 years). The mean level of serum C-peptide was 0.77 ng/mL (0.05-6.8 ng/mL). Of all patients, 43% had preserved C-peptide levels. The mean HbA1c level was 12.1% (6.3%-18.0%). Of all patients, 35.8% presented without DKA at diagnosis. According to BMI, 22.2% of the children were underweight, 63.7% normal weight, and 14.1% overweight or obese (Table 1). As BMI category increased from underweight, to normal weight, to overweight or obese, the proportions of children with preserved C-peptide levels increased from 33.3%, to 41.9%, to 63.2%, respectively, with marginal significance (P=0.051) (Fig. 1A). No significant among-group differences in sex, age at diagnosis, HbA1c level, or presentation without DKA were evident (Table 1).

The clinical and biochemical characteristics of underweight, normal weight, and overweight/obese children

The proportions of preserved C-peptide levels and the odds of such preservation by body mass index (BMI) category. (A) As BMI category increased from underweight, to normal weight, to overweight or obese, the proportions of children with preserved C-peptide levels increased from 33.3%, to 41.9%, to 63.2%, respectively, with marginal significance (P=0.051). (B) In the final multivariate logistic regression model, the odds of C-peptide preservation increased 1.9 fold (P=0.325) in normal weight and 5.0 folds (P=0.042) in overweight or obese children compared with underweight children.
Patients with preserved C-peptide levels were older at onset (10.8 years vs. 7.7 years, P<0.001), more likely to be pubertal (63.8% vs. 29.9%, P<0.001), and presented more frequently without DKA (51.2% vs. 26.2%, P=0.009), compared with the non-preserved C-peptide group. No difference in either HbA1c level at diagnosis or the average HbA1c level during the 2-year follow-up was evident between the two groups (Table 2).

The clinical and biochemical characteristics of patients with versus without preserved C-peptide levels
No interaction of serum C-peptide level with the effect of BMI z-score or category on age at diagnosis was noted. The lower the C-peptide level, the younger the age of onset (P<0.001) after adjustment for BMI z-score and HbA1c level. However, any inverse relationship between BMI z-score or category and age at onset was not statistically significant, regardless of whether the serum C-peptide level was adjusted (Table 3).
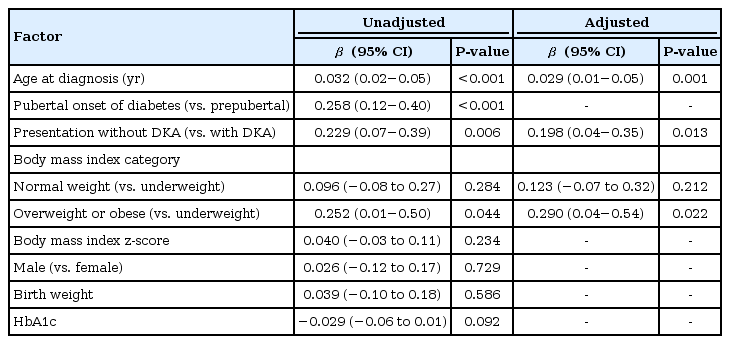
Upon univariate linear regression analysis, older age at onset (P<0.001), initial presentation without DKA (P=0.006), overweight or obese status (P=0.044 vs. underweight status), and pubertal onset of diabetes (P<0.001) were positively associated with serum C-peptide levels. Upon multivariate linear regression analysis, serum C-peptide levels were significantly higher in children of older age at onset (P=0.001), who presented without rather than with DKA (P=0.013), and who were overweight or obese compared with underweight (P=0.022) (Table 4).
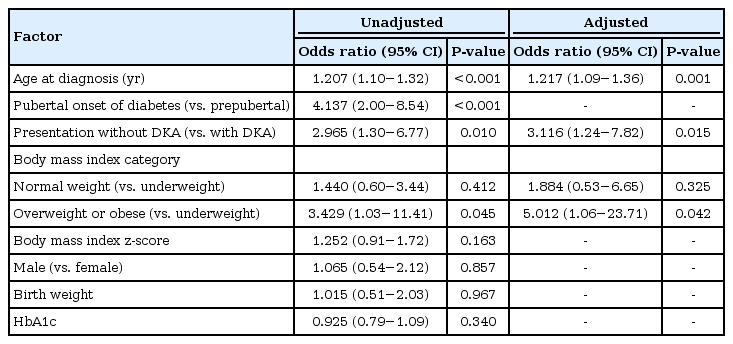
Upon univariate logistic regression analysis, patients with preserved C-peptide levels showed older age at onset (odds ratio [OR], 1.2; P<0.001), initial presentation without DKA (OR, 3.0; P=0.01), overweight or obese status (OR, 3.4; P=0.045 vs. underweight status), and pubertal onset of diabetes (OR, 4.1; P<0.001) compared with those without. In the final multivariate logistic regression model, the odds of C-peptide preservation increased 1.2 fold (95% confidence interval [CI], 1.1-1.4; P=0.001) with each year of age; 3.1 folds (95% CI, 1.2-7.8; P=0.015) in children who presented without rather than with DKA; and 5.0 folds (95% CI, 1.1-23.7; P=0.042) (Fig. 1B) in overweight or obese children compared with underweight children (Table 5).
Discussion
Of 135 pediatric patients with autoimmune T1DM, 14.4 % were overweight or obese. A younger age of onset was significantly associated with lower C-peptide levels, but neither overweight nor obese patients exhibited more rapid onset. An older age of onset, initial presentation without DKA, and overweight or obese status (compared with underweight) were significantly associated with preservation of C-peptide levels at the time of T1DM diagnosis.
Children who were overweight or obese at diagnosis exhibited slightly more residual beta-cell function. Although the significance was marginal, the proportions of patients with preserved C-peptide levels increased as BMI increased from underweight, to normal, to overweight or obese. In a multivariate-adjusted model, C-peptide preservation was more frequently evident in overweight or obese children compared with underweight children at the time of T1DM diagnosis, consistent with the data of previous studies131415). Although overweight or obese children had slightly more residual beta-cell function, such patients developed hyperglycemia and diabetes triggered by the glucotoxicity and lipotoxicity associated with insulin resistance16). The interactions between hyperglycemia and the Fas receptor of beta cells, which trigger apoptosis (glucotoxicity)17) and ectopic fat deposition in islets (lipotoxicity)18), accelerate beta-cell apoptosis when insulin resistance is at play16).
Whether insulin resistance accelerates either progression of insulin deficiency or the timing or onset of T1DM presentation remains controversial. We did not find that heavier children developed diabetes at younger ages. As overweight and obese children tended to have residual C-peptide at diagnosis, we adjusted C-peptide levels in an effort to find an independent relationship between BMI and age at onset. No such relationship was found regardless of adjustment for residual beta-cell function. Some previous studies19202122), but not all, found that heavier children developed diabetes at earlier ages. However, we did not find this relationship, as in some other previous studies1523).
C-peptide levels correlated positively with age at diagnosis and were higher in pubertal than prepubertal children. The older the child, the higher the C-peptide level, consistent with previous studies132324). Puberty affects beta-cell failure; the pubertal growth spurt not only aggravates insulin resistance as a result of increased growth hormone but also increases insulin demand, leading to beta-cell overload and failure. Although the extent of residual beta-cell function was similar, pubertal children were more likely to develop hyperglycemia and diabetes than were prepubertal children.
As expected, C-peptide preservation was associated with presentation in the absence of DKA. Insulin deficiency is a major cause of DKA but, conversely, the metabolic effects of ketoacidosis may temporarily further reduce the ability to secrete insulin13). Thus, children who presented with DKA had significantly lower levels of C-peptide at diagnosis.
Our study had several limitations. The levels of three or more diabetes-related autoantibodies were not measured in all patients at diagnosis. Only BMI was used to assess adiposity. Any difference in the honeymoon phase, or beta-cell loss with preservation of C-peptide levels, could not be evaluated, because daily insulin doses were not recorded reliably, and C-peptide levels were not measured during follow-up. As this retrospective study did not include the measurement of insulin resistance using glucose clamp technique25), the effect of insulin resistance on onset age of T1DM could not be analyzed.
In conclusion, overweight or obese children had slightly more residual beta-cell function at diagnosis than did underweight children. However, we found no evidence that obesity accelerates the timing of T1DM presentation. Further studies should evaluate whether BMI influences progression of beta-cell loss after T1DM onset. Strategies minimizing the loss of residual beta-cell mass in overweight or obese children are required.
Notes
Conflict of interest: No potential conflict of interest relevant to this article was reported.


