Ann Pediatr Endocrinol Metab Search

CLOSE


Ann Pediatr Endocrinol Metab > Volume 20(4); 2015 > Article
Yoo, Kwak, Son, Kim, and Chung: Value of serum 1,5-anhydroglucitol measurements in childhood obesity in the continuum of diabetes

Abstract

Purpose

The prevalence of type 2 diabetes mellitus (T2DM) and obesity are currently increasing. Accordingly, the concept of "preventing diabetes" in high-risk groups has become more important in diabetic care, but the use of glycated hemoglobin (HbA1c) as a measure has limitations in this field. The aim of this study was to investigate the utility of 1,5-anhydroglucitol (1,5-AG) in assessing prediabetes status in obese children.

Methods

The medical records of 74 subjects aged 6-19 years (of which 27 were overweight/obese and 47 had diabetes) who had 1,5-AG data were reviewed retrospectively. We compared 1,5-AG with HbA1c using the Pearson correlation test to assess the clinical utility of 1,5-AG.

Results

1,5-AG levels were higher (31.1±10.1 µg/mL vs. 7.4±7.3 µg/mL) and HbA1c levels were lower (5.5%±0.3% vs. 8.9%±2.7%) in the overweight/obese group than in the diabetics group. The range of 1,5-AG levels in obese children was wide (16.8-59.3 µg/mL), and did not have significance with HbA1c. A negative correlation between 1,5-AG and HbA1c was significant in the entire subject (r=-0.822, P<0.001), and also in the HbA1c range of 5.5% to 8% (r=-0.736, P<0.001).

Conclusion

1,5-AG is a valuable index in the HbA1c range of 5.5%-8% and it might be considered an early glycemic control index in insulin-resistant obese children with an HbA1c level above 5.5%. Moreover, the 1,5-AG level assessment should be presented as a supplementary tool for better compliance, as well as being an improvement in diabetes management for the short-term glucose control in relatively well-controlled diabetes patients with an HbA1c level below 8%.

Introduction

The Diabetes Control and Complications Trial emphasized the need to lower glycated hemoglobin (HbA1c) levels to decrease the risk of chronic complication of diabetes1). HbA1c is the gold standard marker of glycemic control and a useful tool in preventing diabetic complications and educating patients in the clinical setting.
However, HbA1c has a number of limitations. HbA1c is a mean value of glycemia over 2-3 months and cannot capture daily glucose fluctuations2). It is also unable to distinguish between fasting plasma glucose and postprandial blood glucose (PBG)3). Recently, it has been suggested that postprandial hyperglycemia and glycemic excursions contribute to the risk of long-term complications in diabetes, increasing their importance in diabetes management4,5,6). Furthermore, HbA1c levels may be affected in patients with anemia, hemolysis, transfusion, renal disease, liver disease, alcoholism, drug use, and genetic hemoglobin abnormalities7,8).
Wild et al.9) estimated the prevalence of diabetes for all age groups to be 4.4% by 2030 and predicted that if the prevalence of obesity increased, the number of diabetics would be much higher than the estimated value. Thus, it is important to detect individuals with prediabetes who are at high-risk for type 2 diabetes mellitus (T2DM) and with undiagnosed diabetes, so that they receive appropriate early management10).
The three major fundamental components of metabolic disturbances in diabetes are fasting hyperglycemia, postprandial hyperglycemia, and acute glucose fluctuations6). According to previous studies, postprandial hyperglycemia and glycemic excursion are associated with cardiovascular disease11,12,13). Frequent checking of self-monitored blood glucose (SMBG) levels was used to evaluate postprandial hyperglycemia and variation in blood glucose levels14). However, this has limitations in reflecting glucose fluctuations precisely. Continuous glucose monitoring systems (CGMSs) are considered the gold standard for assessing glycemic excursion, but are quite expensive and invasive for wide application14,15). The compound 1,5-anhydroglucitol (1,5-AG) is a glucose analog that declines in hyperglycemic subjects. Recent studies have shown that 1,5-AG is reflective of PBG, glucose excursions, and short-term glucose status8,11,14). The Food and Drug Administration has recently validated 1,5-AG as a marker of short-term (2-3 weeks) glucose control status2,16).
The purpose of this study was to assess the clinical utility of 1,5-AG in early diabetes detection in patients with prediabetes status by comparison with HbA1c in overweight and obese (OWOB) children.

Materials and methods

1. Study population

This study was approved by the Institutional Review Board of Konkuk University Medical Center, Seoul, Korea (IRB No.: KUH1090036). The need for informed consent was waived. In total, 74 participants diagnosed with OWOB (body mass index [BMI] z-score ≥1.04, same as the 85th percentile) or diabetes were enrolled between August 2011 and January 2015 at Konkuk University Medical Center. The subjects (44 girls, 30 boys) were 14.3±3.6 years of age and were classified into two groups: OWOB and diabetes. The OWOB group included patients who were overweight (1.04≤BMI z-score<1.65, n=12) or obese (BMI z-score≥1.65, n=15) by 2007 Korean National Growth Charts17), and the diabetes group included patients who were type 1 diabetes mellitus (T1DM, n=26) or T2DM (n=21). The exclusion criteria included acute or severe chronic diabetes, severe comorbid disorders, and other acute illnesses that affected blood glucose. No subject had anemia, chronic kidney disease, or liver failure, and none were pregnant.

2. Biochemical measurement

Measurement of serum glycemic markers was performed as follows: plasma AG concentrations were measured using an enzymetric colorimetric assay (Kyowa Medex, Tokyo, Japan). And, HbA1c was assayed by high-performance liquid chromatography using Varaiant TM II turbo (Bio-Rad Laboratories, Hercules, CA, USA).

3. The criteria of HbA1c and 1,5-AG

According to previous study, the level of HbA1c for assessing impaired glucose tolerance (IGT) is 5.5%. And HbA1c>8% is usually considered to indicate poorly controlled diabetes18). Thus, we divided the subjects into three groups by HbA1c: <5.5%, 5.5%-8%, and >8%. The relationship between 1,5-AG and HbA1c was compared depending on this classification.
To determine the reference value of 1,5-AG, we followed previous studies. Kim and Park19) suggested that diabetes subjects with low 1,5-AG (<10 µg/mL) were more prone to diabetic complications than those with high 1,5-AG (≥10 µg/mL). In another population-based cohort study in Japan, 23.1 µg/mL was determined as the cutoff value of nondiabetic reference subjects20). Thus, we accepted 10 µg/mL as the lower cutoff, and 23.1 µg/mL as the upper cutoff value of 1,5-AG.

4. Statistical analysis

Statistical analyses were performed using IBM SPSS Statistics ver. 21.0 (IBM Co., Armonk, NY, USA). Descriptive statistics are presented as mean±standard deviation or proportions. Student t-test and one-way analysis of variance (ANOVA) were used to compare the mean values of variables. Logarithmic transformation of the 1,5-AG values was performed to assess the linear correlation between logarithmic transformed 1,5-AG values (ln [1,5-AG]) and HbA1c. We compared 1,5-AG with HbA1c using the Pearson correlation test. P-values<0.05 were considered to indicate statistical significance.

Results

1. Comparison of clinical parameters between the OWOB and diabetes groups

The clinical characteristics of the subjects are presented in Table 1. The subjects were composed of two groups: the OWOB (n=27; overweight:obese, 12:15; 36.5% of all subjects) and diabetes (n=47; T1DM:T2DM, 26:21; 63.5% of all subjects) groups.
In OWOB group, the mean age was 12.6±2.9 years, the HbA1c was 5.5%±0.3%, and the 1,5-AG was 31.1±10.1 µg/mL. In Diabetes group, the mean age was 15.3±3.5 years, the levels of HbA1c was 8.9%±2.7%, and the 1,5-AG was significantly lower than OWOB group as 7.4±7.3 µg/mL. The mean duration of diabetes was 3.3±3.0 years.
The mean age of the OWOB group was 12.6±2.9 years, younger than that of the diabetes (15.3±3.5 years). The levels of HbA1c and glucose were significantly lower, whereas 1,5-AG was higher in the OWOB group than in the diabetes group (31.1±10.1 µg/mL vs. 7.4±7.3 µg/mL, P<0.001). The HbA1c of the OWOB group was 5.5%±0.3%, and that of the diabetes group was 8.9%±2.7%. The mean duration of diabetes was 3.3±3.0 year.
The subjects were divided into 3 subgroups according to HbA1c: <5.5%, 5.5%-8%, and >8%. The patient's characteristics and the average values of the clinical parameters (age, gender, BMI z-score, and laboratory findings: glucose, lipid panel, and creatinine) were assessed using ANOVA and are presented in Table 2. Among them, the differences in HbA1c, glucose, and 1,5-AG were significant (P<0.001).

2. Distribution of 1,5-AG and the correlation between 1,5-AG and HbA1c

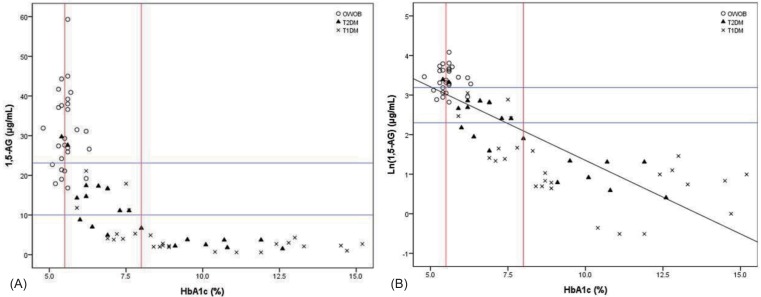
Most of the subjects with HbA1c<5.5% were in the OWOB group, except one who had well-controlled T2DM. This group showed substantial variation in 1,5-AG (17.9-44.3 µg/mL), and had no correlation between 1,5-AG and HbA1c levels. For HbA1c>8%, all subjects were diabetics and none of the OWOB were included. The 1,5-AG levels were 2.4±1.1, in the range of 0.6-4.9 µg/mL, and also 1,5-AG did not correlate with HbA1c. However, for the HbA1c range of 5.5%-8%, each 1,5-AG was distributed more widely in the range of 3.8-59.3 µg/mL, and correlated significantly with HbA1c (r=-0.736, P<0.001).
Fig. 1A shows the distribution of 1,5-AG according to HbA1c levels. The relationship between ln (1,5-AG) and HbA1c is shown in Fig. 1B. 1,5-AG was negatively correlated with HbA1c in the entire subject (r=-0.822, P<0.001), as it was in the diabetes group (r=-0.719, P<0.001). However, the 1,5-AG levels in the OWOB group had a wide range (16.8-59.3 µg/mL) and were not correlated with HbA1c (Table 3). For HbA1c≤8%, ln (1,5-AG) was inversely correlated with HbA1c (r=-0.746, P<0.001). Among the diabetes in this range, 1,5-AG levels were <10 µg/mL in nine subjects and ≥10 µg/mL in 14 subjects. The 1,5-AG levels in the latter group increased, up to 29.7 µg/mL, close to the normal range.

Discussion

1,5-AG is a six-carbon monosaccharide, the 1-deoxy form of glucose, that was first discovered in 188816,21). Because of its structural similarity to glucose, absorption of 1,5-AG is competitively inhibited by glucose in the proximal tubule if the renal threshold for glycosuria (generally>180 mg/dL in serum glucose) is reached8,21), after which levels of 1,5-AG in serum decrease rapidly8,21). Thus, patients with diabetes usually have markedly lower 1,5-AG levels than the healthy population22). The reported 1,5-AG range is quite wide, 0.49-110 µg/mL, and the intra- and interassay coefficients of variation are small23). The sensitivity and specificity of 1,5-AG has been reported as being superior to HbA1c and fructosamine, respectively, and is 84.2% and 93.1% when the cutoff of the 1,5-AG concentration is determined as 14 µg/mL24,25).
The amount of 1,5-AG is generally maintained at approximately 500-1,000 mg in total23). This originates mainly from food (4.4 mg/day), whereas its biosynthesis only provides a small source (~0.5 mg/day)26); 1,5-AG is balanced by urinary excretion, and its renal reabsorption is ~99.9%16). However, it can be affected by medications, diet, age, gender, race, and various pathological conditions (renal disease, liver disease, gastrectomy state, and cystic fibrosis)19). 1,5-AG is derived mainly from food and is influenced by diet and some medications19). The major food source is soy, and a small amount is included in rice, meat, fish, fruit, vegetable, tea, milk, and cheese23). A previous study showed that 1,5-AG decreased with aging in both sexes, and was higher in males than in females27); 1,5-AG was also significantly higher in Asian and African patients than in Caucasians19,23).
1,5-AG is suitable for evaluating short-term glucose status, glucose excursions, and PBG and thus is suitable for use in monitoring strict glycemic control19,28). Because postprandial hyperglycemia is a known risk factor for cardiovascular disease, control of PBG is an important target in glycemic control11). Stettler et al.29) showed that 1,5-AG was an optimal indicator of the 2-hour PBG value. According to Schindhelm et al.30), 1,5-AG was significantly inversely correlated with PBG, and the strongest association was seen in the second week, compared with HbA1c, which is considered to reflect mean glucose levels over the last 3 months. Sun et al.14) analyzed the correlation between 1,5-AG and glycemic excursion, using CGMS, and 1,5-AG was more closely related to glycemic excursions than HbA1c. However, unlike SMBG or CGMS, 1,5-AG does not provide information about the peak timing of hyperglycemia19). Besides, in some patients, there is a discordance between 1,5-AG and other glycemic markers; the reason for this discordance is presently unknown31).
Recently, markedly increased T2DM, even in children, could lead to profound economic costs for diabetic care and managing complications related to diabetes, and the importance of identifying prediabetics has increased9,32). Thus, today, early detection of prediabetes and appropriate intervention in early diabetes are very important in preventing the progress of diabetes32). Several prospective studies showed that 5-year cumulative incidence of diabetes was 12%-25% in subjects with HbA1c between 5.5% and 6%33,34,35,36). Data from National Health and Nutrition Examination Survey indicated that the subjects with HbA1c between 5.5% and 6% were prone to impaired fasting glucose or IGT. Therefore, subjects with HbA1c between 5.5% and 6% should be initiated preventive intervention37). In this study, we decided a lower cutoff of HbA1c, 5.5%, for prediabetes.
In this study, we compared 1,5-AG with HbA1c, the "traditional" standard marker of glycemic control, in the OWOB and diabetes groups. The 1,5-AG levels were significantly inversely correlated with HbA1c 5.5%-8%. The 1,5-AG values of diabetes subjects overlapped with the OWOB group when HbA1c was ≤8%, whereas most of the poorly controlled diabetics (HbA1c>8%) had prominently low levels of 1,5-AG, and showed no correlation between 1,5-AG and HbA1c, and this result was consistent with a previous report on severely uncontrolled diabetes19). According to this, 1,5 AG was a valuable index in prediabetic obese children and relatively well-controlled diabetic patients with HbA1c between 5.5% and 8%.
As mentioned earlier, 1,5-AG might be a more valuable marker of a detailed glucose status for the segment with HbA1c≤8%. This may imply that 1,5-AG better reflects glycemic changes of prediabetes than HbA1c. It was previously reported that serum 1,5-AG concentrations were lower in nondiabetic subjects with a family history of T2DM than in those with no family history38). The level of 1,5-AG, while maintained within the normal range, was decreased in IGT subjects39). The proportion of this reduction was correlated with the degree of glucose tolerance impairment. 1,5-AG precisely detected slight glycemic changes promptly, even in the near-normoglycemic range40). Also, HbA1c, fasting glucose, and 1,5-AG were reported as good predictive factors of T2DM in obese patients32). Among them, HbA1c and 1,5-AG were strong predictive variables of prediabetes just before T2DM in insulin-resistant obese patients32). Therefore, we suggested that the level of 1,5-AG could play a role in the continuum of diabetes in obese subject with a HbA1c level of less than 6.5% with glucose fluctuations and postprandial hyperglycemia.
1,5-AG is a valuable index in the HbA1c range 5.5%-8% and it might be considered as an early glycemic control index in obese patients with HbA1c levels of more than 5.5%., such as IGT or insulin-resistant obese children. Also, 1,5-AG level assessments should be stressed as a supplementary tool for better compliance as well as improvement of short-term glucose control in diabetes management in relatively well-controlled diabetes patients with an HbA1c level of less than 8%.
This study had several limitations. First, it is a retrospective study based on past medical records. Second, the small sample size and short follow-up durations of diabetes were additional limitations. Third, we could not examine patient glucose variability or peak glucose levels by CGMS or SMBG and were unable to include patients with large glucose variability. However, we did not select specific patients, thus more accurately reflecting a realistic diabetic population. Further studies are needed for 1,5-AG to be recognized as an early glycemic marker in prediabetes.

Notes

Conflict of interest: No potential conflict of interest relevant to this article was reported.

References

1. The effect of intensive treatment of diabetes on the development and progression of long-term complications in insulin-dependent diabetes mellitus. The Diabetes Control and Complications Trial Research Group. N Engl J Med 1993;329:977–986. PMID: 8366922.
crossref pmid
2. Goldstein DE, Little RR, Lorenz RA, Malone JI, Nathan D, Peterson CM, et al. Tests of glycemia in diabetes. Diabetes Care 2004;27:1761–1773. PMID: 15220264.
crossref pmid
3. Avignon A, Radauceanu A, Monnier L. Nonfasting plasma glucose is a better marker of diabetic control than fasting plasma glucose in type 2 diabetes. Diabetes Care 1997;20:1822–1826. PMID: 9405900.
crossref pmid
4. Effect of intensive blood-glucose control with metformin on complications in overweight patients with type 2 diabetes (UKPDS 34). UK Prospective Diabetes Study (UKPDS) Group. Lancet 1998;352:854–865. PMID: 9742977.
pmid
5. Siegelaar SE, Holleman F, Hoekstra JB, DeVries JH. Glucose variability; does it matter? Endocr Rev 2010;31:171–182. PMID: 19966012.
crossref pmid pdf
6. Colette C, Monnier L. Acute glucose fluctuations and chronic sustained hyperglycemia as risk factors for cardiovascular diseases in patients with type 2 diabetes. Horm Metab Res 2007;39:683–686. PMID: 17846977.
crossref pmid pdf
7. Freedman BI, Shenoy RN, Planer JA, Clay KD, Shihabi ZK, Burkart JM, et al. Comparison of glycated albumin and hemoglobin A1c concentrations in diabetic subjects on peritoneal and hemodialysis. Perit Dial Int 2010;30:72–79. PMID: 20056983.
crossref pmid
8. Kim WJ, Park CY. Review of the potential glycemic markers glycated albumin and 1,5-anhydroglucitol. J Korean Diabetes 2012;13:1–6.
crossref
9. Wild S, Roglic G, Green A, Sicree R, King H. Global prevalence of diabetes: estimates for the year 2000 and projections for 2030. Diabetes Care 2004;27:1047–1053. PMID: 15111519.
crossref pmid
10. Demmer RT, Zuk AM, Rosenbaum M, Desvarieux M. Prevalence of diagnosed and undiagnosed type 2 diabetes mellitus among US adolescents: results from the continuous NHANES, 1999-2010. Am J Epidemiol 2013;178:1106–1113. PMID: 23887044.
crossref pmid pmc pdf
11. Sato A. Indicators of glycemic control -- hemoglobin A1c (HbA1c), glycated albumin (GA), and 1,5-anhydroglucitol (1,5-AG). Rinsho Byori 2014;62:45–52. PMID: 24724426.
pmid
12. DECODE Study Group. the European Diabetes Epidemiology Group. Glucose tolerance and cardiovascular mortality: comparison of fasting and 2-hour diagnostic criteria. Arch Intern Med 2001;161:397–405. PMID: 11176766.
crossref pmid
13. Quagliaro L, Piconi L, Assaloni R, Martinelli L, Motz E, Ceriello A. Intermittent high glucose enhances apoptosis related to oxidative stress in human umbilical vein endothelial cells: the role of protein kinase C and NAD(P) H-oxidase activation. Diabetes 2003;52:2795–2804. PMID: 14578299.
crossref pmid
14. Sun J, Dou JT, Wang XL, Yang GQ, Lu ZH, Zheng H, et al. Correlation between 1,5-anhydroglucitol and glycemic excursions in type 2 diabetic patients. Chin Med J (Engl) 2011;124:3641–3645. PMID: 22340217.
pmid
15. Marling CR, Shubrook JH, Vernier SJ, Wiley MT, Schwartz FL. Characterizing blood glucose variability using new metrics with continuous glucose monitoring data. J Diabetes Sci Technol 2011;5:871–878. PMID: 21880228.
crossref pmid pmc
16. McGill JB, Cole TG, Nowatzke W, Houghton S, Ammirati EB, Gautille T, et al. Circulating 1,5-anhydroglucitol levels in adult patients with diabetes reflect longitudinal changes of glycemia: a U.S. trial of the GlycoMark assay. Diabetes Care 2004;27:1859–1865. PMID: 15277408.
crossref pmid
17. Moon JS, Lee SY, Nam CM, Choi JM, Choe BK, Seo JW, et al. 2007 Korean National Growth Charts: review of developmental process and an outlook. Korean J Pediatr 2008;51:1–25.
crossref
18. Nowicka P, Santoro N, Liu H, Lartaud D, Shaw MM, Goldberg R, et al. Utility of hemoglobin A(1c) for diagnosing prediabetes and diabetes in obese children and adolescents. Diabetes Care 2011;34:1306–1311. PMID: 21515842.
crossref pmid pmc
19. Kim WJ, Park CY. 1,5-Anhydroglucitol in diabetes mellitus. Endocrine 2013;43:33–40. PMID: 22847316.
crossref pmid
20. Watanabe M, Kokubo Y, Higashiyama A, Ono Y, Miyamoto Y, Okamura T. Serum 1,5-anhydro-D-glucitol levels predict first-ever cardiovascular disease: an 11-year population-based cohort study in Japan, the Suita study. Atherosclerosis 2011;216:477–483. PMID: 21414624.
crossref pmid
21. Buse JB, Freeman JL, Edelman SV, Jovanovic L, McGill JB. Serum 1,5-anhydroglucitol (GlycoMark ): a short-term glycemic marker. Diabetes Technol Ther 2003;5:355–363. PMID: 12828817.
crossref pmid
22. Yamanouchi T, Akanuma H, Nakamura T, Akaoka I, Akanuma Y. Reduction of plasma 1,5-anhydroglucitol (1-deoxyglucose) concentration in diabetic patients. Diabetologia 1988;31:41–45. PMID: 3350220.
crossref pmid pdf
23. Dungan KM. 1,5-anhydroglucitol (GlycoMark) as a marker of short-term glycemic control and glycemic excursions. Expert Rev Mol Diagn 2008;8:9–19. PMID: 18088226.
crossref pmid
24. Frattali AL, Wolf BA. 1,5-Anhydroglucitol: a novel serum marker for screening and monitoring diabetes mellitus? Clin Chem 1994;40(11 Pt 1):1991–1993. PMID: 7955366.
crossref pmid
25. Yamanouchi T, Akanuma Y, Toyota T, Kuzuya T, Kawai T, Kawazu S, et al. Comparison of 1,5-anhydroglucitol, HbA1c, and fructosamine for detection of diabetes mellitus. Diabetes 1991;40:52–57. PMID: 2015974.
crossref pmid
26. Yamanouchi T, Tachibana Y, Akanuma H, Minoda S, Shinohara T, Moromizato H, et al. Origin and disposal of 1,5-anhydroglucitol, a major polyol in the human body. Am J Physiol 1992;263(2 Pt 1):E268–E273. PMID: 1514606.
crossref pmid
27. Ouchi M, Oba K, Yamashita H, Okazaki M, Tsunoda M, Ohara M, et al. Effects of sex and age on serum 1,5-anhydroglucitol in nondiabetic subjects. Exp Clin Endocrinol Diabetes 2012;120:288–295. PMID: 22421984.
crossref pmid
28. Won JC, Park CY, Park HS, Kim JH, Choi ES, Rhee EJ, et al. 1,5-Anhydroglucitol reflects postprandial hyperglycemia and a decreased insulinogenic index, even in subjects with prediabetes and well-controlled type 2 diabetes. Diabetes Res Clin Pract 2009;84:51–57. PMID: 19187997.
crossref pmid
29. Stettler C, Stahl M, Allemann S, Diem P, Schmidlin K, Zwahlen M, et al. Association of 1,5-anhydroglucitol and 2-h postprandial blood glucose in type 2 diabetic patients. Diabetes Care 2008;31:1534–1535. PMID: 18426859.
crossref pmid pmc
30. Schindhelm RK, Diamant M, Bilo HJ, Slingerland RJ. Association of 1,5-anhydroglucitol and 2-h postprandial blood glucose in type 2 diabetic patients: response to Stettler et al. Diabetes Care 2008;31:e89. author reply e90. PMID: 18955716.
crossref pmid
31. Kishimoto M, Yamasaki Y, Kubota M, Arai K, Morishima T, Kawamori R, et al. 1,5-Anhydro-D-glucitol evaluates daily glycemic excursions in well-controlled NIDDM. Diabetes Care 1995;18:1156–1159. PMID: 7587851.
crossref pmid
32. Shah S, Kublaoui BM, Oden JD, White PC. Screening for type 2 diabetes in obese youth. Pediatrics 2009;124:573–579. PMID: 19620188.
crossref pmid
33. Edelman D, Olsen MK, Dudley TK, Harris AC, Oddone EZ. Utility of hemoglobin A1c in predicting diabetes risk. J Gen Intern Med 2004;19:1175–1180. PMID: 15610327.
crossref pmid pmc
34. Pradhan AD, Rifai N, Buring JE, Ridker PM. Hemoglobin A1c predicts diabetes but not cardiovascular disease in nondiabetic women. Am J Med 2007;120:720–727. PMID: 17679132.
crossref pmid pmc
35. Sato KK, Hayashi T, Harita N, Yoneda T, Nakamura Y, Endo G, et al. Combined measurement of fasting plasma glucose and A1C is effective for the prediction of type 2 diabetes: the Kansai Healthcare Study. Diabetes Care 2009;32:644–646. PMID: 19131461.
crossref pmid pmc
36. Shimazaki T, Kadowaki T, Ohyama Y, Ohe K, Kubota K. Hemoglobin A1c (HbA1c) predicts future drug treatment for diabetes mellitus: a follow-up study using routine clinical data in a Japanese university hospital. Transl Res 2007;149:196–204. PMID: 17383593.
crossref pmid
37. American Diabetes Association. Diagnosis and classification of diabetes mellitus. Diabetes Care 2010;33(Suppl 1):S62–S69. PMID: 20042775.
crossref pmid pmc pdf
38. Tsukui S, Fukumura Y, Kobayashi I. Decreased serum 1,5-anhydroglucitol in nondiabetic subjects with a family history of NIDDM. Diabetes Care 1996;19:940–944. PMID: 8875086.
crossref pmid
39. Yamanouchi T, Inoue T, Ogata E, Kashiwabara A, Ogata N, Sekino N, et al. Post-load glucose measurements in oral glucose tolerance tests correlate well with 1,5-anhydroglucitol, an indicator of overall glycaemic state, in subjects with impaired glucose tolerance. Clin Sci (Lond) 2001;101:227–233. PMID: 11524039.
crossref pmid
40. Yamanouchi T, Akaoka I. Clinical significance of plasma 1,5-anhydroglucitol analysis in the diagnosis of diabetes mellitus. Nihon Rinsho 1990;48(Suppl):374–380. PMID: 2086911.
pmid
Fig. 1

(A) Relationship between 1,5-anhydroglucitol (1,5-AG) and HbA1c in the overweight/obese (OWOB) and the diabetes (T1DM and T2DM) groups. Reference cutoff values of 1,5-AG were 23.1 and 10 µg/mL and reference cutoff values of HbA1c are 5.5% and 8.0%. (B) The logarithmic transformed 1,5-AG value (ln [1,5-AG]) was inversely correlated with HbA1c, and ln (1,5-AG) and HbA1c also showed a modest linear correlation in subjects with HbA1c≤8%; OWOB group (open circle), diabetes group (T1DM: cross, T2DM: closed triangle). HbA1C, glycosylated hemoglobin; T1DM, type1 diabetes mellitus; T2DM, type2 diabetes mellitus.

apem-20-192-g001.jpg
Table 1

Characteristics and laboratory findings in subjects with OWOB group and diabetes group (n=74)

Variable OWOB (n=27) Diabetes (n=47) P-value
Age (yr) 12.6±2.9 15.3±3.5 0.002
Sex, male:female 15:12 15:32 -
Body mass index, z-score 1.9±0.7 0.5±1.2 <0.001
 Underweight (z<-1.65) - 1 -
 Normal (-1.65≤z<1.04) - 30 -
 Overweight (1.04≤z<1.65) 12 8 -
 Obese (z≥1.65) 15 8 -
HbA1c (%) 5.5±0.3 8.9±2.7 <0.001
Glucose (mg/dL) 97.1±10.0 205.8±129.8 <0.001
1,5-AG (µg/mL) 31.1±10.1 7.4±7.3 <0.001
Ln (1,5-AG) 3.4±0.3 1.5±1.0 <0.001
Creatinine (mg/dL) 0.6±0.1 0.7±0.1 0.001
AST (IU/L) 29.4±12.0 28.3±4.2 0.847
ALT (IU/L) 37.0±28.7 34.7±53.2 0.839
Total cholesterol (mmol/L) 173.3±32.9 182.4±46.1 0.366
LDL cholesterol (mmol/L) 102.7±27.7 98.0±39.4 0.588
HDL cholesterol (mmol/L) 48.0±10.1 57.7±15.1 0.004
Triglyceride (mmol/L) 116.2±71.9 118.0±114.6 0.918
Diabetes duration (yr) - 3.3±3.0 -

Values are presented as mean±standard deviation or number. P-values were calculated by Student t-test.

OWOB, overweight/obese; HbA1C, glycosylated hemoglobin; Ln (1,5-AG), logarithmic transformed 1,5-AG values; AST, aspartate aminotransferase; ALT, alanine aminotransferase; LDL, low-density lipoprotein; HDL, high-density lipoprotein.

Table 2

Comparison of the subjects' clinical parameters according to HbA1c

Variable HbA1C<5.5% (n=12) 5.5%≤HbA1C≤8% (n=38) HbA1C>8% (n=24) P-value
Age (yr) 11.9±3.4 14.3±3.6a) 15.5±3.0a) 0.017*
Sex, male:female 7:5 15:23 8:16 0.358
Body mass index, z-score 1.8±0.3 1.2±1.3a) 0.3±2.5a) 0.002*
HbA1c (%) 5.3±0.2 6.4±0.8 11.0±2.2 <0.001*
Glucose (mg/dL) 96.0±10.9a) 124.4±52.6a) 267.3±148.2 <0.001*
1,5-AG (µg/mL) 29.6±9.0 20.4±13.2 2.4±1.1 <0.001*
Ln (1,5-AG) 3.3±0.3 2.8±0.7 0.7±0.6 <0.001*
Creatinine (mg/dL) 0.5±0.1 0.7±0.1a) 0.7±0.1a) 0.007*
AST (U/L) 28.8±10.5 24.5±10.7 35.3±38.8 0.223
ALT (U/L) 34.4±28.3 28.2±23.2 47.8±71.5 0.262
Total cholesterol (mmol/L) 170.8±44.8a) 168.8±26.2a) 199.5±53.1 0.012*
LDL cholesterol (mmol/L) 100.0±37.4 93.2±27.5 110.0±43.8 0.194
HDL cholesterol (mmol/L) 47.8±10.1 53.0±12.3 59.1±17.3 0.061
Triglyceride (mmol/L) 113.2±42.1 99.6±72.8 148.9±145.7 0.169

Values are presented as means±standard deviation or number.

HbA1C, glycosylated hemoglobin; Ln (1,5-AG), logarithmic transformed 1,5-AG values; AST, aspartate aminotransferase; ALT, alanine aminotransferase; LDL, low-density lipoprotein; HDL, high-density lipoprotein.

a),b)Statistical significance was assessed by one-way analysis of variance among groups. The same letters indicate a nonsignificant difference between groups based on the Scheffe multiple comparison test. *P<0.05.

Table 3

Correlation coefficients for the relationship between ln (1,5-AG) and HbA1c in each group and subgroup by HbA1c range

Group r P-value
Total -0.822 <0.001
 Diabetes (T1DM:T2DM, 26:21) -0.719 <0.001
 OWOB (overweight:obese, 12:15) -0.007 0.972
HbA1c
 ≤8% (OWOB:diabetes, 27:23) -0.746 <0.001
 5.5% (OWOB:diabetes, 11:1) 0.041 0.900
 5.5%-8% (OWOB:diabetes, 16:22) -0.736 <0.001
 >8% (OWOB:diabetes, 0:24) -0.126 0.557

P-values were calculated by Pearson correlation coefficient.

Ln (1,5-AG), logarithmic transformed 1,5-AG values; HbA1C, glycosylated hemoglobin; r, Pearson correlation coefficient; T1DM, type1 diabetes mellitus; T2DM, type2 diabetes mellitus; OWOB, overweight/obese.

TOOLS
Share :
Facebook Twitter Linked In Google+
METRICS Graph View
  • 4 Crossref
  •   Scopus
  • 8,654 View
  • 105 Download
Related articles in APEM


ABOUT
ARTICLE CATEGORY

Browse all articles >

BROWSE ARTICLES
AUTHOR INFORMATION
Editorial Office
501-107, 30 Seocho-daero 74-gil, Seocho-gu, Seoul 06622, Republic of Korea
Tel: +82-2-3471-4268    Fax: +82-2-3471-4269    E-mail: editor@e-apem.org                

Copyright © 2024 by Korean Society of Pediatric Endocrinology.

Developed in M2PI

Close layer
prev next