Serum vitamin D status in children and adolescence with diabetes according to season and age
Article information
Abstract
Purpose
It is known that children with diabetes have more severe vitamin D deficiency than healthy children. This study aimed to investigate serum vitamin D status and analyze the relationships between serum vitamin D levels and clinical parameters in children with diabetes.
Methods
We checked serum vitamin D levels of children with diabetes aged below 18 years who were treated at our Department of Pediatrics between December 2011 and February 2012 (winter) as well as between June 2012 and August 2012 (summer). We retrospectively analyzed relationships between their serum vitamin D levels and clinical parameters.
Results
The serum 25-hydroxyvitamin D level in children with diabetes during winter was markedly lower than during summer (10.8±5.1 ng/mL vs. 17.6±5.6 ng/mL); vitamin D deficiency was more prevalent during winter (95% vs. 62%). However, there was no difference between children with diabetes and healthy children. In children with type I diabetes mellitus, among all the clinical parameters, age had the greatest negative correlation with serum vitamin D level.
Conclusion
In children with diabetes, serum vitamin D levels showed marked seasonal variation. However, no clear relationship was identified between vitamin D deficiency and diabetes. This was because the control group had an equally high vitamin D deficiency rate. Additional studies including other clinical parameters after vitamin D supplementation in children with diabetes should be considered.
Introduction
Vitamin D is known to affect calcium metabolism, bone growth, and (along with parathyroid hormone) maintenance of mineral homeostasis. Recently, the vitamin D receptor has been discovered in various tissues in the body; it is necessary to convert 1 alpha-hydroxylase (1-hydroxylase) into the active form of vitamin D. Therefore, the functions of vitamin D have been described through a new perspective1). The most common cause of vitamin D deficiency is inadequate sun exposure. Vitamin D deficiency causes not only skeletal disease such as rickets and osteomalacia but also nonskeletal diseases such as malignancies and cardiovascular and autoimmune diseases2,3).
Pittas et al.4) and Zipitis and Akobeng5) reported that vitamin D supplementation affected the development of type 1 and 2 diabetes mellitus (DM). Therefore, this study aimed to investigate the variations in serum vitamin D levels in children and adolescents with diabetes according to season and age in comparison to those in healthy children and to analyze the relationships between serum vitamin D level and clinical parameters in children with diabetes.
Materials and methods
1. Subjects
We evaluated the serum vitamin D levels of children with diabetes who were younger than 18 years and treated at the Department of Pediatrics, Chonbuk National University Hospital, between December 2011 and February 2012 (winter) and June 2012 and August 2012 (summer). We retrospectively compared children with diabetes and healthy children in terms of vitamin D serum level and deficiency rate, and analyzed the relationships between serum vitamin D level and clinical parameters (age, body mass index [BMI], glucose, alkaline phosphatase [ALP], cholseterol, triglyceride, lipid profile, C-peptide, glycosylated hemoglobin [HbA1c], insulin dose) in children with diabetes. None of the study subjects received vitamin D supplementation during the study period.
The children with diabetes were further classified according to age as follows: the elementary school group (age, 7-12 years), the middle school group (age, 13-15 years), and the high school group (age, 16-18 years). Data obtained from all groups was compared and analyzed.
2. Anthropometric and laboratory measurements
Serum levels of 25-hydroxyvitamin D (25-OHD) were detected by performing chemiluminescence immunoassay; deficiency was defined as a level of vitamin D<20 ng/mL.
3. Statistical analysis
All analyses were conducted by using the PASW ver. 18.0 (SPSS Inc., Chicago, IL, USA). All variables were expressed as the means±standard deviations. The independent two-sample t-tests and one-way analysis of variance were used to compare clinical parameters between groups. Relationships between serum vitamin D levels and clinical parameters were assessed by using Pearson correlation coefficient and second-order partial correlation, controlling for age and BMI. Statistical significance was defined as P<0.05 for all clinical and laboratory data.
Results
1. General characteristics
There were 66 (type 1, 51; type 2, 15) and 71 (type 1, 51; type 2, 20) children with diabetes in summer and winter, respectively. The healthy control groups, matched according to age and sex, consisted of 49 and 87 children in winter and summer, respectively (Table 1). BMIs were markedly higher in children with type 2 DM than in the control group or those with type 1 DM.
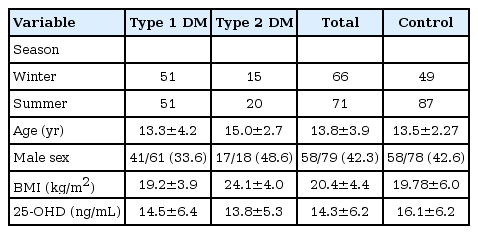
Demographic findings and 25-OHD level of patients with diabetes and healthy control groups (n=115)
2. Clinical characteristics of children with diabetes and vitamin D deficiency rate in winter
The mean age of the children with diabetes was 14.5±4.3 years and that of the control group children was 14.4±1.9 years, which is similar. However, serum levels of cholesterol and low-density lipoprotein (LDL) showed significant differences (Table 2).
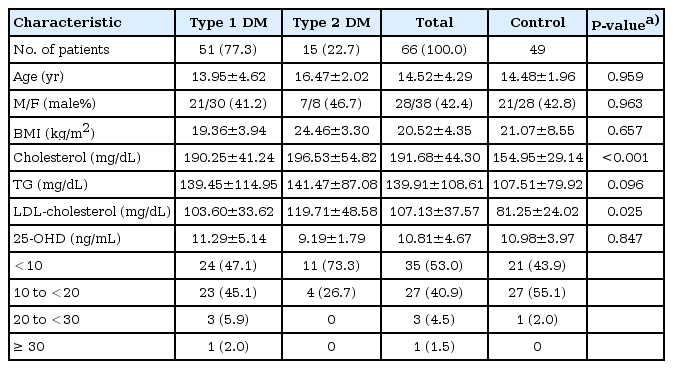
Clinical characteristics of patients with diabetes during winter (n=115)
In the children with diabetes, serum levels of 25-OHD were low (10.8±4.7 ng/mL) and the vitamin D deficiency rate was 94%. The control group also showed low serum levels of 25-OHD (11.0±4.0 ng/mL) and high vitamin D deficiency rate (98%), similar to the diabetes group. However, in children with diabetes, there were more patients with serum 25-OHD levels below 10 ng/mL than in the control group.
Among the 66 children with diabetes, children with type 2 DM were excluded because of insufficient numbers; the remaining 51 were compared and analyzed according to school grade and age. As shown in Table 3, there were remarkable differences in the duration of diabetes, BMIs, ALP levels, and lipid profiles, but no differences were seen in serum glucose and HbA1c levels. Serum 25-OHD levels in the elementary school group were higher than in the middle and high school groups (14.8±6.0, 8.97±2.86, and 9.06±2.92 ng/mL, respectively). However, vitamin D deficiency rates were high in all groups (elementary school group, 80%; middle and high school groups, 100%). There was no difference between the type 1 DM group and the control group (Table 4).
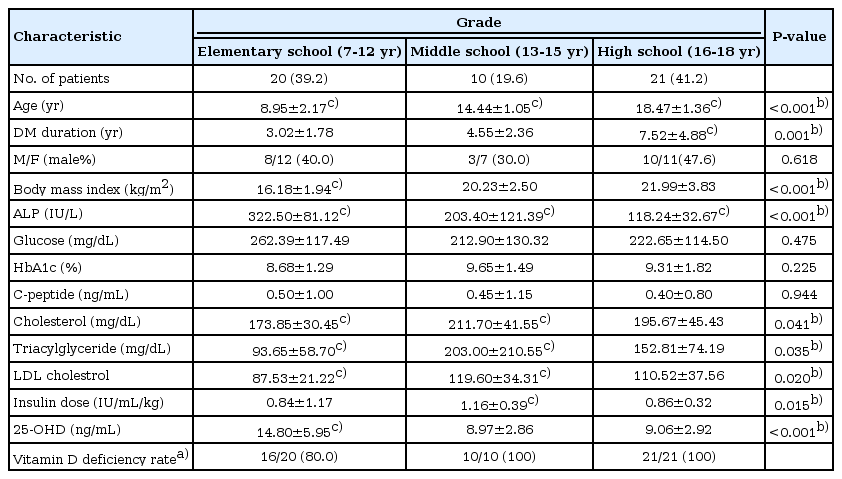
Clinical characteristics according to age in patients with type 1 DM during winter (n=51)

Comparision between type 1 DM patients and control groups in 25-OHD level and vitamin D deficiency according to age
3. Clinical characteristics of children with diabetes and vitamin D deficiency rate in summer
In summer, the age and sex ratio was similar between the diabetes and control groups, but BMI and serum levels of cholesterol, triglycerides, and LDL were higher in the diabetes group (Table 5). The diabetes and control groups had serum 25-OHD levels of 17.6±5.6 and 18.9±5.3 ng/mL, respectively. The absolute levels were higher in summer than in winter, but there was no difference between both groups. Vitamin D deficiency rates were relatively high, with results of 62.0% (diabetes group) and 65.5% (control group). The percentage of patients with serum 25-OHD levels below 10 ng/mL was 8.5% and 3.4% in the diabetes and control groups, respectively. In summer, we compared and analyzed 51 children with diabetes according to school grade and age (Table 6). Similar to winter, the serum 25-OHD levels were higher in the elementary school group than in the middle and high school groups (20.28±5.09, 16.35±6.28, and 15.21±5.95 ng/mL, respectively). Vitamin D deficiency rates were higher in the middle and high school groups than in the elementary school group (76.9%, 75.0%, and 36.4%, respectively). There was no difference between the type 1 DM and control groups (Table 4).

Clinical characteristics of patients with diabetes during summer (n=193)
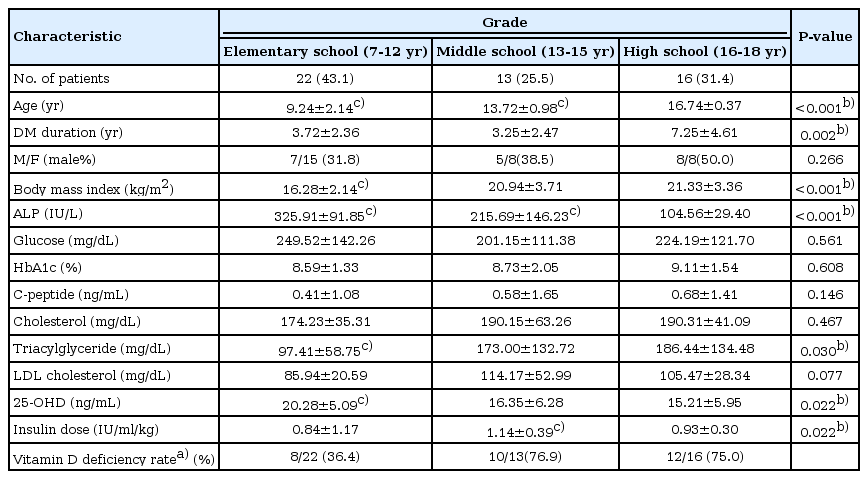
Clinical characteristics according to age in patients with Type 1 DM during summer (n=51)
4. Relationship with serum vitamin D levels and clinical parameter
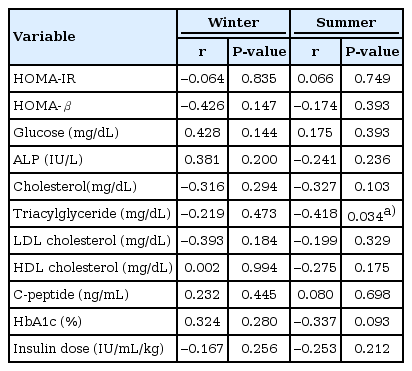
In children with type 1 DM, serum vitamin D levels had a negative relationship with age, BMI, ALP, cholesterol, and triglyceride levels in winter. Among the clinical parameters, age had the strongest negative correlation with serum vitamin D levels in winter (Table 7). However, serum vitamin D levels did not have significant relationships with insulin doses or serum glucose and HbA1c levels. Age had the greatest negative relationship with serum vitamin D levels in summer too. In addition, serum 25-OHD levels had a significant negative relationship with insulin doses in summer. When second-order partial correlation, controlling for age and BMI, was performed, triglyceride had a negative relationship with serum vitamin D levels in summer (Table 8).

Correlation coefficients of vitamin D level with other variables in patients with type 1 DM
Correlation coefficients of vitamin D level with other variables controlling for age and bmi in patients with type 1 DM
Discussion
Vitamin D is a fat-soluble vitamin and it can be classified as a prohormone as its action mechanism is similar. Vitamin D has five forms (D1-D5), among which ergocalciferol and cholecalciferol are known to be important in humans. Vitamin D is abundant in animal-derived foods such as blue colored fish, egg yolks, butter, margarine, and in plant-based foods such as mushrooms. However, the majority of vitamin D needed is produced in the skin by exposure to ultraviolet B (UVB) radiation rather than obtained through dietary intake6). During exposure to sunlight, Vitamin D3 is produced from 7-dehydrocholesterol in the skin7).
The skin's capacity to synthesize vitamin D decreases with aging and increasing pigmentation of the skin. Living at higher altitudes and fewer outdoor activities increase the risk of vitamin D deficiency7). The vitamin D deficiency rate is higher in winter than in summer, because there is insufficient sunlight during winter to stimulate the production of vitamin D in the skin. Vitamin D deficiency is also caused by chronic kidney disease, hepatic failure, and drugs that increase vitamin D clearance, such as rifampin, antiepileptic drugs, glucocorticoids, and immunosuppressants1).
Traditionally, vitamin D is known to affect calcium metabolism, bone growth, and (along with parathyroid hormone) maintenance of mineral homeostasis. Recently, various studies are being carried out to clarify the relationship between vitamin D and diabetes4,5,8).
The prevalence of diabetes is increasing worldwide as well as in South Korea. Huh et al.9) reported that the maximum insulin secretory ability of the Korean population is less than half of that in the western population. Serum insulin levels in the Korean population start to decrease at lower serum glucose levels than in the western population. As a result, the Korean population cannot tolerate even a mild insulin resistant state, and diabetes develops more easily10). Therefore, prevention of diabetes needs more attention in Korea.
The incidence of type 1 DM is related to regional and seasonal factors11,12,13). In a study on the association between UVB radiation, vitamin D status, and incidence rates of type 1 DM in 51 regions worldwide, an association was found between low UVB radiation and higher incidence rate of type 1 DM in children14). Thus, we predicted that vitamin D can lower the risk of type 1 DM. Another study suggested that increased intake of vitamin D lowered the incidence of type 1 DM in later life5). Another European study identified that vitamin D supplementation in children significantly reduced the risk of type 1 DM15). Although the exact mechanism of how vitamin D reduces the incidence of type 1 DM has not been identified, previous studies have suggested that vitamin D acts as an immunosuppressant, lowers proliferation of lymphocytes, production of cytokines, suppresses the release of interferon-γ and interleukin-216,17), and also inhibits the destruction of pancreatic cells18). Through these anti-inflammatory processes, vitamin D can suppress the death of pancreatic β cells and play a preventive role in type 1 DM19,20). In case of type 2 DM, high intake of vitamin D has been identified to lower the risk of type 2 DM through a large cohort study21). The release of insulin is dependent on calcium metabolism22). Deficiency of vitamin D or calcium is considered to cause an imbalance of calcium in pancreatic β-cells and eventually affect the release of insulin4).
In this study, we were able to recognize that serum vitamin D levels underwent seasonal variations in children with diabetes. We considered the possibility that outdoor activities are relatively restricted in children with diabetes as compared to healthy subjects, leading to presumably higher vitamin D deficiency rates in children with diabetes. However, there was no significant difference in vitamin D deficiency rates between both groups. Another study reports that vitamin D deficiency is very common in Korean adolescents23).
In this study, serum vitamin D levels had negative relationships with age, BMI, and ALP and triglyceride levels in children with type 1 DM. This phenomenon seemed to be related to the duration of outdoor activities. Additionally, several studies show that weight may influence vitamin D levels24,25), as body fat acts as a reservoir for vitamin D, reducing its bioavailability26).
Our study has several limitations. It was a retrospective study from a single institute. Therefore, it does not represent the whole diabetic population. Confounding factors such as intake of vitamin D-rich foods and duration of outdoor activities were not considered in this study. In addition, the observation periods were relatively short.
In conclusion, a clear relationship between vitamin D deficiency and diabetes was not identified in the study. In children with diabetes, serum vitamin D levels had marked seasonal variation, but there was no difference when compared with the healthy children group. This occurred because the healthy patient group had an equally high vitamin D deficiency rate. A more in-depth study is required, and additional studies including factors such as changes in glucose levels and clinical parameters after vitamin D supplementation in children with diabetes should be considered.
Notes
No potential conflict of interest relevant to this article was reported.