Comparison of anthropometric, metabolic, and body compositional abnormalities in Korean children and adolescents born small, appropriate, and large for gestational age: a population-based study from KNHANES V (2010–2011)
Article information

Abstract
Purpose
The impacts of growth restriction and programming in the fetal stage on metabolic and bone health in children and adolescents are poorly understood. Moreover, there is insufficient evidence for the relationship between current growth status and metabolic components. Herein, we compared the growth status, metabolic and body compositions, and bone mineral density in Korean children and adolescents based on birth weight at gestational age.
Methods
We studied 1,748 subjects (272 small for gestational age [SGA], 1,286 appropriate for gestational age [AGA], and 190 large for gestational age [LGA]; 931 men and 817 women) aged 10–18 years from the Korean National Health and Nutrition Examination Survey (KNHANES) V (2010–2011). Anthropometric measurements, fasting blood biochemistry, and body composition data were analyzed according to birth weight and gestational age.
Results
The prevalence of low birth weight (14.7% vs. 1.2% in AGA and 3.2% in LGA, p<0.001) and current short stature (2.237 [1.296–3.861] compared to AGA, p=0.004) in SGA subjects was greater than that in other groups; however, the prevalence of overweight and obesity risks, metabolic syndrome (MetS), and MetS component abnormalities was not. Moreover, no significant differences were found in age- and sex-adjusted lean mass ratio, fat mass ratio, truncal fat ratio, bone mineral content, or bone density among the SGA, AGA, and LGA groups in Korean children and adolescents.
Conclusions
Our data demonstrate that birth weight alone may not be a determining factor for body composition and bone mass in Korean children and adolescents. Further prospective and longitudinal studies in adults are necessary to confirm the impact of SGA on metabolic components and bone health.
Highlights
· We studied whether the impact of birth weight on current growth, metabolic alterations, body composition, and bone mineral density in korean children and adolescents.
· Children and adolescents born small for gestational age had increased risk of short stature and underweight, not metabolic component abnormalities, compared to those born appropriate gestational age.
· The birth weight at gestational age alone may not be a determinant factor for the achievement of body composition and bone mass for growing Korean children and adolescents. Rather, current body weight could be more important.
Introduction
Children born small for gestational age (SGA) are known to have long-term metabolic effects. Many studies have demonstrated that weight gain during the fetal, perinatal, and infant periods is associated with cardiometabolic parameters in childhood and adolescents. Intrauterine growth restriction and fetal programming are known to influence cardiometabolic health in childhood and adolescents. In observational studies of adults, a larger number of metabolic abnormalities, such as hypertension, diabetes, and dyslipidemia, have been observed in individuals born SGA [1-4]. Furthermore, during the last decade, the prevalence of metabolic syndrome (MetS) has increased with increasing calorie-dense food intake in Korean children and adolescents [5].
A few studies have revealed that the SGA group with obesity has more severe problems with obesity than the non-SGA group, even with the same state of high body mass index (BMI), suggesting that birth weight has an impact on adult bone mass. Some studies showed that birth weight is positively associated with greater bone mineral content (BMC). In SGA infants, rapid postnatal catch-up growth is a risk factor for many problems, such as body composition alteration, later obesity, and MetS. Both children born SGA and large for gestational age (LGA) have obesity and obesity-related morbidities; however, the evidence for whether this association is only mediated by adiposity is conflicting [6,7].
In growing children, there are little data on the relationship between current growth status and metabolic components based on birth weight at gestational age. The potential impact of birth size on bone accrual and its interaction with body composition in SGA children is under debate. Several studies have revealed that, compared to children born appropriate for gestational age (AGA), SGA infants are lighter and have less body fat. However, other studies have shown that SGA individuals are more likely to experience obesity during childhood, particularly when they exhibit catch-up growth. Stefan et al. found that the known cardiovascular risks among infants born SGA, AGA, and LGA are not reflected in metabolic consequences at the ages of 6–12 years [8,9].
In this study, we examined the effect of birth weight at gestational age on current growth, metabolic alterations, bone mineral density (BMD), and body composition in children and adolescents using Korean population data.
Materials and methods
1. Subjects
This study used data from the Korean National Health and Nutrition Examination Survey (KNHANES) V (2010–2011). The KNHANES is a nationally representative, periodically conducted, cross-sectional survey conducted by the Division of Chronic Disease Surveillance of the Korea Centers for Disease Control and Prevention and the Korean Ministry of Health and Welfare (https://knhanes.kdca.go.kr/). Procedures performed in the KNHANES adhered to ethical guidelines. In total, 2,018 children and adolescents aged 10–18 years were enrolled. Among the participants, 270 participants without anthropometric or laboratory data were excluded. A total of 1,748 participants (931 men and 817 women) finally was included in the analysis, representing the total population of 4,328,424 individuals aged 10–18 years in Korea. Subjects were categorized into 3 groups according to birth weight by gestational age (BWGA) and sex based on a study using Korean statistics [10] and by definition [11]: SGA (BWGA < 10th percentile), AGA (10th percentile ≤ BWGA ≤ 90th percentile), and LGA (BWGA > 90th percentile).
2. Data collection
Demographic characteristics were age, sex, height, weight, BMI, waist circumference (WC), blood pressure (BP), birth weight, gestational age, delivery type, household income, physical activity, current smoking and alcohol status, and daily calorie and food intake. The percentiles of height, weight, BMI, WC, and BP were calculated based on the 2007 Korean National Growth Chart [12]. Household income was stratified into quartiles as 1–4. Physical activity was defined as moderate or vigorous exercise. Dietary data were evaluated via a 24-hour recall nutrition survey. Biochemical samples were obtained after ≥8 hours of fasting. Fasting plasma glucose (FPG), lipid profiles, and liver enzyme levels were measured using a Hitachi Automatic Analyzer 7600 (Hitachi, Tokyo, Japan). Fasting insulin levels were evaluated using an immunoradiometric assay (INS-IRMA; Biosource, Nivelles, Belgium) with a 1470 Wizard gamma counter (PerkinElmer, Turku, Finland). The homeostasis model assessment of insulin resistance (HOMAIR) result was assessed as follows: fasting insulin (mU/L) × FPG (mmol/L)/22.5.
Body composition and BMD were measured using wholebody dual-energy x-ray absorptiometry with a QDR Discovery fan-beam densitometer (Hologic Inc., Bedford, MA, USA). BMD z-scores for the lumbar spine (LS), femur neck (FN), and whole bone except the head (WB) were calculated according to the reference values for Korean children and adolescents [12,13].
3. Definition of the metabolic component abnormalities and MetS in children and adolescents
Underweight status was defined as BMI <10th percentile by age and sex, while overweight and obesity were defined as 85th percentile ≤BMI <95th percentile and BMI ≥95th percentile, respectively. For diagnosis of MetS in Korean children and adolescents, both the International Diabetes Federation (IDF) and the modified National Cholesterol Education Program— Adult Treatment Panel III (NCEP-ATP III) criteria were used [14]. For diagnosing MetS, the IDF criteria includes central obesity (WC ≥90 cm in boys or ≥80 cm in girls or ≥90th percentile) and at least 2 of the following characteristics: (1) triglyceride (TG) level ≥150 mg/dL; (2) high-density lipoprotein (HDL)-cholesterol level ≤40 mg/dL (or, in adolescents aged >16 years, ≤40 mg/dL in boys and ≤50 mg/dL in girls); (3) systolic BP ≥130 mmHg or diastolic BP ≥85 mmHg; and (4) FPG ≥100 mg/dL. For diagnosing MetS, the modified NCEP-ATP-III criteria include the presence of 3 or more of the following characteristics: (1) WC ≥90th percentile; (2) TG ≥110 mg/dL; (3) HDL cholesterol ≤40 mg/dL; (4) systolic BP or diastolic BP ≥ 90th percentile; and (5) FPG ≥110 mg/dL [15]. The metabolic abnormality score was calculated as a total score of 5 points across the 5 parameters (central obesity, high TG, low HDL-C, high BP, high FPG), with each contributing 1 point.
4. Statistical analyses
For continuous variables, the numerical data are presented as mean±standard deviation, while categorical variables are presented as percentage and frequency. One-way analysis of variance with post hoc analysis (Tukey test) and the chi-square test were used to identify significant differences among the 3 groups (SGA, AGA, and LGA). Multiple logistic regression analysis was used to assess the odds ratios (ORs) of the prevalence of short stature, underweight status, and metabolic changes in the SGA and LGA groups compared to the AGA group. Graphs were arranged using GraphPad Prism version 6 for Windows (GraphPad Software Inc., San Diego, CA, USA). IBM SPSS Statistics ver. 22 (IBM Corp., Armonk, NY, USA) was used to analyze data, and P<0.05 was considered statistically significant.
5. Ethical statement
This study was approved by the Institutional Review Board of Chungnam National University Hospital (approval No. 2023-02-096).
Results
1. Clinical and laboratory characteristics
Anthropometric and laboratory characteristics are summarized in Table 1. The prevalence rates of SGA, AGA, and LGA were 15.5% (n=272), 73.6% (n=1,286), and 10.9% (n=190), respectively. In the SGA group, the height, weight, BMI, WC, birth weight, and gestational age were significantly less than those in the AGA or LGA groups. However, age, sex, BP, lipid profile, alanine transaminase, fasting glucose, insulin, HOMAIR score, maternal age, delivery type, socioeconomic status, physical activity, lifestyle behaviors, and food intake were not significantly different among the 3 groups.

Auxologic and laboratory information of subjects
2. Comparison of current growth status according to BWGA
The prevalence rates of short stature (height <3rd percentile) and near-short stature (height <10th percentile) in children and adolescents born SGA were 2.6% and 9.2%, respectively, which were higher than those in subjects born AGA (1.0%, P=0.187; 3.7%, P<0.001, respectively) or LGA (0%, P=0.045; 1.6%, P<0.001) [16]. In the case of height <10th percentile, SGA births were most common at 9.2%, while AGA births composed 2.7% and LGA births composed 1.6% of all individuals with height <10th percentile (P<0.001). The prevalence of underweight in those born SGA (16.5%) was also greater than that of those born AGA (10.3%, P=0.009) or LGA (9.5%, P=0.046) (Fig. 1A). However, the prevalence of overweight and obesity was not significantly different among subjects born SGA, AGA, and LGA (Fig. 1B).

Prevalence of growth abnormalities. Comparison of the prevalence of growth abnormalities according to birth weight at gestational age. (A) Current short stature <3rd percentile and <10th percentile for age and sex among the SGA, AGA, and LGA groups. (B) Current underweight status (BMI <10th percentile), overweight status (85th percentile ≤BMI <95th percentile), and obesity (BMI ≥95 percentile) among the SGA, AGA, and LGA groups. Data are represented as mean±standard error of the mean. SGA, small for gestational age; AGA, appropriate for gestational age; LGA, large for gestational age; NS, not significant. *P<0.05, **P<0.01.
Multiple logistic regression analysis was used to estimate the risk of current short stature or underweight according to BWGA. Children and adolescents born SGA had increased risk of short stature (OR, 2.237; 95% confidence interval [CI], 1.296– 3.861; P=0.004), underweight (OR, 1.669; 95%, CI 1.133–2.458; P=0.010), and short stature with underweight (OR, 4.376; 95% CI, 1.317–14.542; P=0.016) compared to those born AGA, after adjusting for confounding factors (Table 2).
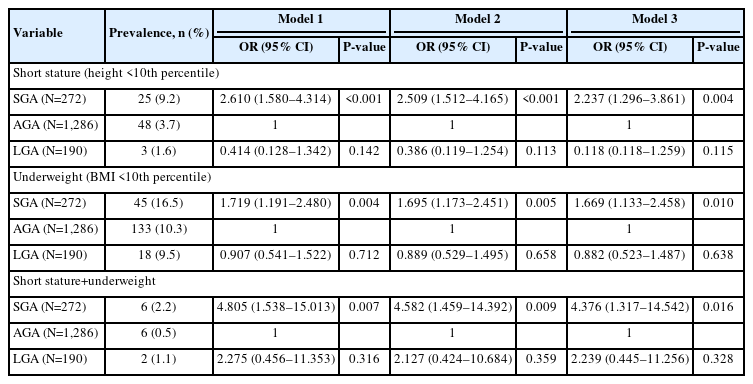
Multiple logistic regression analysis
3. Comparison of metabolic abnormalities according to BWGA in children and adolescents with/without overweight or obesity
The metabolic abnormality score and the prevalence of metabolic component abnormalities and MetS did not differ significantly among subjects born SGA, AGA, or LGA (Fig. 2A1, A2). Moreover, no significant differences were found in subjects with overweight or obesity according to BWGA (Fig. 2B1, B2).
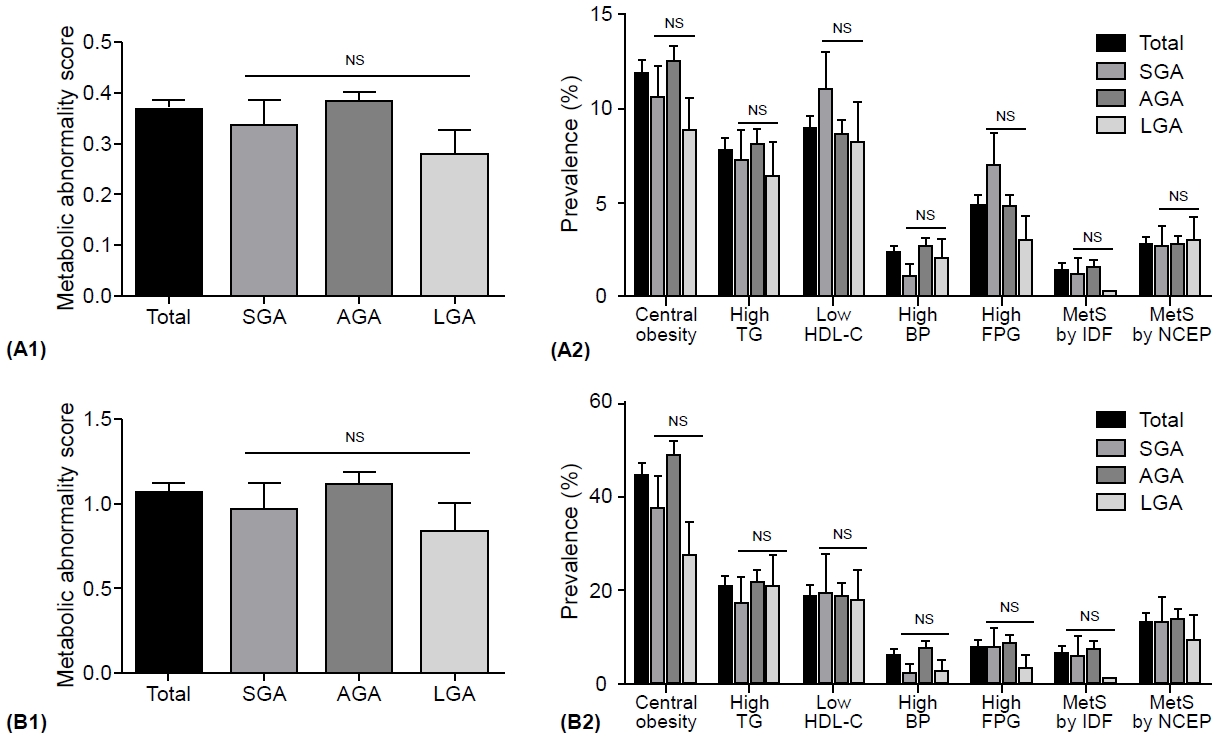
Metabolic component abnormalities and metabolic syndrome. Comparison of metabolic component abnormalities and metabolic syndrome in Korean children and adolescents according to birth weight at gestational age. (A1, A2) Metabolic abnormality score and the prevalence of metabolic component abnormality and metabolic syndrome in all subjects. (B1, B2) Metabolic abnormality score and the prevalence of metabolic component abnormality and metabolic syndrome in subjects with overweight and obesity statuses. Metabolic abnormality score: total (5)=central obesity (1) + high TG (1) + low HDL-C (1) + high BP (1) + high FPG (1). Metabolic component abnormalities and metabolic syndrome defined by the IDF and modified NCEP-ATP III for children and adolescents. Data are represented as mean±standard error of the mean. SGA, small for gestational age; AGA, appropriate for gestational age; LGA, large for gestational age; TG, triglyceride; low HDL-C, high-density lipoprotein-cholesterol; BP, blood pressure; FPG, fasting plasma glucose; MetS, metabolic syndrome; IDF, International Diabetes Federation; NCEP, National Cholesterol Education Program-Adult Treatment Panel III (NCEP-ATP III); NS, not significant.
4. Comparison of body composition and BMD according to BWGA
Weight (P=0.010), lean mass (P=0.014), fat mass (P=0.016), and truncal fat (P=0.036) in SGA girls were lower than those in LGA girls. Body composition, including lean mass ratio, fat mass ratio, and truncal fat ratio, were not significantly different between the sexes, according to BWGA. The BMD z-scores of LS, FN, and WB showed an increasing trend with birth weight (SGA<AGA<LGA); however, there were no significant differences among the groups (Table 3).

Body composition and bone density
Discussion
This study revealed that (1) children and adolescents born SGA had increased risk of short stature, underweight and short stature with underweight compared to those born AGA; (2) the metabolic abnormality score and the prevalence of metabolic component abnormalities and MetS did not differ significantly among subjects born SGA, AGA or LGA; and (3) there was no significant difference in body composition or bone density in Korean children and adolescents among the groups.
Our study examined anthropometric measures and growth status, metabolic and body component proportions, and BMD among Korean children and adolescents born SGA, AGA, and LGA from Korean population data. The prevalence rates of SGA, AGA, and LGA births were 15.5%, 73.6%, and 10.9%, respectively, which are similar to those in other countries (e.g., the United States, Norway) [17,18].
A significant risk factor for onset of MetS is low birth weight, which increases the risk of morbidity in adulthood. Byberg et al. [19] observed that BWGA has a negative association with insulin resistance, truncal fat, and hypertension over a longterm period. In another study, no correlations were found between low birth weight and MetS in children and young adults [20,21]. Height and weight at birth were positively correlated with adult height and weight; however, only a weak correlation was observed for BMI and waist/hip ratio [22,23].
In the current study, we found no significant differences in the prevalence of metabolic abnormality scores, component abnormalities, or MetS. Moreover, we found no differences in BWGA in the overweight and obesity groups. Our results showed that SGA with obesity did not induce larger increased metabolic alterations with obesity than AGA or LGA in Korean children and adolescents. There is a need for additional research on the association between low birth weight and metabolic risk.
Being born SGA may facilitate excessive abdominal fat accumulation in children and could be a significant factor of MetS. These children have less subcutaneous fat but the same amount of visceral fat as AGA children, with an increased ratio of visceral to subcutaneous fat [24-27]. SGA individuals had significantly more total abdominal fat mass along with higher proportions of truncal and abdominal fat mass [28]. Some studies have revealed that adiposity in SGA subjects is the adaptive mechanism to increase energy balance or leptin resistance [29]. LGA infants are more likely to become overweight or obese children, adolescents, and young adults. They also have an increased risk of MetS in later life. Despite their larger bodies, children born LGA have a balanced body composition and fat distribution. Conversely, regardless of body size, children born SGA have increased central adiposity [30].
However, data from previous studies on the correlation between BWGA and current fat mass in adolescents and young adults are conflicting. Several studies have reported a correlation between birth weight for gestational age and childhood body fat in adolescents and young adults [31,32]. Meanwhile, other studies have revealed a negative association [33,34]. It is unclear whether such a correlation might be the result of rapid postnatal catchup growth, a low birth weight, or the combination of the two.
In the current study comparing body composition, our data showed that body composition, including lean mass ratio, fat mass ratio, and truncal fat ratio, did not significantly differ according to BWGA. A study on Brazilian adolescents reported an association between fat mass and postnatal weight gain [35]. Leunissen et al. [36] reported that childhood weight gain is a significant factor in young adult body composition, but that birth size is less important. The heterogeneity of the SGA group might be a contributing factor to the discrepancy between these results.
In preterm and SGA children, low birth weight negatively influences BMD and BMC. In AGA infants, postnatal growth patterns have been linked to bone mineral accumulation [37,38]. However, the effect of catch-up growth in infancy on bone accumulation in SGA infants has not been consistently studied. Previous studies on SGA bone health have suggested that SGA infants born with rapid catch-up growth encounter negative effects of bone development. BMD accrual during infancy and later was correlated with the rates of free fat mass, fat mass, and weight gain during the first month of life. It remains unknown whether birth size is always a major component of bone mass in adolescence and later life, though fat mass and postnatal growth are normal [39]. Deodati et al. [40] suggested that SGA children with compensatory catch-up growth achieve body composition and bone mass similar to those born AGA.
In our study, we recorded no significant differences in ageand sex-adjusted lean body mass ratio, fat mass ratio, truncal fat ratio, BMC, and bone density in Korean children and adolescents between the SGA, AGA, and LGA groups. Our data demonstrated that birth weight at gestational age alone might not be a determining factor for body composition and bone density during growth in Korean children and adolescents. Therefore, we suggest that current low body weight and short stature may be more important factors than birth size, affecting bone health in the AGA, LGA, and SGA groups.
This investigation was a cross-sectional study conducted only from 2010–2011 and had limitations, as information on sexual maturity, catch-up growth, bone age, and genetic background was not provided and is subject to recall bias of dietary records. Although it is strengthened by a large-scale nationwide study, it has other limitations because studies conducted periodically have not been merged.
In conclusion, our data demonstrate that birth weight at gestational age alone may not determine body composition, including metabolic alterations and bone density, during growth in Korean children and adolescents. Rather, current body weight could be more important. It is advised that SGA children should be regularly followed up by pediatricians to monitor catch-up growth, body composition, and metabolic parameters. Prospective longitudinal studies in childhood and adolescence are necessary to confirm the impact of SGA on metabolic components and bone health. Overall, our study could help support the effective management of SGA infants for better long-term metabolic consequences.
Notes
Conflicts of interest
No potential conflict of interest relevant to this article was reported.
Funding
This study received no specific grant from any funding agency in the public, commercial, or not-for-profit sectors.
Data availability
The data that support the findings of this study can be provided by the corresponding author upon reasonable request.
Author contribution
Conceptualization: TKL; Data curation: YMK, HHL; Methodology: TKL, YMK, HHL; Writing - original draft: TKL; Writing - review & editing: TKL