


Highlights
· Mothers' insulin resistance (IR) was not associated with their infants' IR, birth-size or adiposity.
· Birth-weight was independently associated with mother' weight, body mass index, and parity.
· There was high incidence of impaired foetal growth among the infants.
Introduction
A healthy pregnancy is associated with decreased response to insulin, resulting in decreased cellular glucose uptake and optimization [1]. This pregnancy-related decreased insulin sensitivity, or insulin resistance (IR), is attributed to decreased activation of the glucose transporter GLUT4 [2]. Homeostatic model assessment of IR (HOMA-IR) is the most widely used method of assessing IR clinically and epidemiologically [3,4]. IR is not limited to pregnant patients but may also affect offspring, influenced by genetic, nutritional and environmental factors [5]. IR, in mothers and/or their infants, predisposes to cardiometabolic disorders like obesity, diabetes and hypertension [6,7]. Hence, there is a need to identify early-life risk factors, especially during pregnancy, that may be targeted to mitigate these adverse outcomes.
Maternal obesity, excessive intrapregnancy weight gain and maternal IR independently, but variably, impair fetal growth and adiposity and birth size [8-11]. Impaired fetal growth (IFG) (which includes wasting or stunting) or excessive fetal growth (EFG) (macrosomia or large-for-gestational-age [LGA] birth) increases the risk of cardiometabolic disorders intergenerationally [12-14]. While the adverse association of maternal IR with birth size is well-known among pregnant women with pregestational diabetes, gestational diabetes (GDM) or maternal obesity [15,16], findings are somewhat conflicting among healthier non-GDM cohorts [11,17,18]. Specifically, studies are scarce on the prospective association of maternal IR with neonatal IR, birth size and composition in non-GDM, nonobese pregnant women in sub-Saharan Africa, including Nigeria. Earlier cited findings from higher-income countries may not be generally applicable because of wide geographic variations in the genetic, environmental, dietary and socioeconomic determinants of maternal characteristics and perinatal outcomes. Moreover, the scarcity of local reference values for HOMA-IR for healthy African infants limits its clinical and epidemiologic interpretation, as normal values may vary among racial populations.
The goal of our study was to (1) determine the association of IR (measured with HOMA-IR) of healthy nondiabetic singleton pregnant women in the third trimester with their infants' IR, birth size (weight, length, head circumference [HC]) and body composition (wasting, stunting); (2) describe the incidence of IFG (stunting, wasting, small-for-gestation-age [SGA]) and EFG (macrosomia, LGA) using the INTERGROWTH-21 growth standards among their offspring; and (3) propose reference values for neonatal HOMA-IR.
Materials and methods
1. Study population and design
The study involved a prospective cohort involving 401 singleton nondiabetic pregnant women recruited at the third trimester and followed up until birth at the Obstetrics & Gynaecology Department of the Lagos State University Teaching Hospital (LASUTH), Ikeja, Lagos, Nigeria [19]. We excluded those with chronic medical conditions including diabetes or hypertension. The baseline data of the participants were reported previously [19]. Herein, we report the findings of 150 mother-neonate dyads (before closure of the study due to fund limitation).
2. Ethical considerations and permission
The study was approved by the Health Research Ethics Committee, and written informed consent was obtained from all participants (LREC/06/10/1323).
3. Data collection
Recruitment and sample collection took place between September 2020 and May 2021. At recruitment, we used selfdesigned structured data collection forms to obtain maternal anthropometric (weight, height), demographic (age, education, occupation) and clinical (family history of diabetes) data from the participants or their medical records. Venous samples were obtained from mothers for fasting serum glucose (FSG) and insulin (FSI) assays, and HOMA-IR was estimated as [(FSI × FSG)/22.5)], as previously described [19]. Within 48 hours of birth, venous blood was collected from each infant within 3 hours of a feeding for serum glucose and insulin assays, and HOMAIR was calculated. All samples were centrifuged for 15 minutes and stored at -80℃ until analysis at the Research Laboratory of the Lagos State University College of Medicine. We extracted neonatal outcome data for gestational age (GA), sex, and anthropometric measurements (birth weight in grams; birth length and HC in cm) from routinely collected birth records.
4. Operational definitions
We [19] previously defined maternal overweight, hyperglycaemia, hyperinsulinaemia and elevated HOMA-IR as thirdtrimester weight ≥95 kg [20], FSG >91.0 mg/dL [21], FSI >20 μU/mL [22], and HOMA-IR >75th centile (corresponding to >1.96) [23]; similarly, we define elevated neonatal HOMA-IR as HOMAIR >75th centile. Measures of neonatal body size included birth weight and its categorical derivatives: SGA (weight-for-GA < 10th centile on INTERGROWTH-21st growth standards) [24], LGA (weight-for-GA > 90th centile), appropriatefor-gestational-age (AGA) (weight-for-GA between 10th and 90th centile), and macrosomia (birth weight > 3,999 g); birth length and its categorical derivative: stunting (birth length < 3rd centile); and HC and its categorical derivative: microcephaly defined as HC <3rd centile. Measures of neonatal body composition included wasting defined as weight-length ratio (WLR) < 3rd centile [25]. WLR is a better measure of neonatal adiposity than body mass index (BMI) or ponderal index [26].
5. Data management
Data were analysed with JASP Statistics ver. 0.17.1.0 (University of Amsterdam, Netherlands; https://jasp-stats.org/) and Bluesky Statistics ver. 7.50 (BlueSky Statistics LLC, Chicago, IL, USA; https://www.blueskystatistics.com/). We used the INTERGROWTH-21st International Standards for Size at Birth software version 1.0.6257.25111 (INTERGROWTH-21st, Oxford, UK; https://intergrowth21.tghn.org/newborn-size-birth/) to convert weight, length and HC to corresponding centiles and z-scores and an Excel-based calculator (https://intergrowth21.tghn.org/site_media/media/medialibrary/2019/08/INTERGROWTH_
WLR_at_birth_calculator_-_New.xlsx) to convert WLR to centiles and z-scores. Distribution of continuous variables was assessed with Shapiro-Wilke test and histogram and Q-Q plots. Continuous and categorical variables were summarised with independent t-test (or Mann-Whitney test if skewed) and frequencies/percentages, respectively. We used paired t-test (or Wilcoxon signed-rank test) and McNemar test to compare continuous and categorical variables, respectively, between mother-infant dyads. Kruskal-Wallis test was used to compare continuous variables among 3 groups. Pearson or Spearman correlation coefficients were used to assess linear correlation between continuous variables, while hierarchical multivariable linear regression was used to assess independent predictors of outcomes. P-value <0.05 was noted as statistically significant at a 95% confidence interval (CI).
WLR_at_birth_calculator_-_New.xlsx) to convert WLR to centiles and z-scores. Distribution of continuous variables was assessed with Shapiro-Wilke test and histogram and Q-Q plots. Continuous and categorical variables were summarised with independent t-test (or Mann-Whitney test if skewed) and frequencies/percentages, respectively. We used paired t-test (or Wilcoxon signed-rank test) and McNemar test to compare continuous and categorical variables, respectively, between mother-infant dyads. Kruskal-Wallis test was used to compare continuous variables among 3 groups. Pearson or Spearman correlation coefficients were used to assess linear correlation between continuous variables, while hierarchical multivariable linear regression was used to assess independent predictors of outcomes. P-value <0.05 was noted as statistically significant at a 95% confidence interval (CI).
Initial descriptive and bivariate analyses were conducted with complete case analyses; subsequent regression analyses were conducted after single imputation of missing values using the random forest model submenu of the single imputation function in Bluesky Statistics.
Results
1. Baseline maternal characteristics
The baseline socio-demographic, anthropometric, obstetric, and medical characteristics of 150 mothers with neonatal outcomes were similar to those of the 251 mothers without neonatal outcomes, except for family history of diabetes, which was more common in the group of mothers with neonatal data (21.33% vs. 10.57%, P=0.003) (Supplementary Table 1). In this largely middle-high income cohort, the proportions of women with overweight and hyperglycaemia at enrolment were 8.0% and 8.0%, respectively.
2. Socio-demographic and anthropometric characteristics of neonates
As shown in Table 1, 150 neonates, with female:male ratio of 1.2:1.0, were born between 37–42 weeks of gestation. Using the INTERGROWTH-21st standards, their birth weight, birth length and HC centiles were normal (48th–66th centiles). The proportions of neonates with wasting, stunting, IFG (either wasting or stunted), SGA, LGA, LBW and macrosomia were 4.2% (95% CI, 1.1–10.3), 19.7% (12.9–28.0), 23.1% (15.8–31.8), 10.1% (5.3–17.0), 12.6% (7.2–19.9), 0.8% (0.02–4.5), and 5.0% (1.8–10.5), respectively; none of them was microcephalic or wasted and stunted simultaneously.
3. Association between maternal and neonatal IR
Table 2 shows the mean, median and percentile values of maternal and neonatal serum glucose, insulin and HOMAIR. Paired mother-neonate comparison of the 3 analytes showed significantly lower neonatal values (P<0.001). Maternal HOMA-IR was not linearly correlated with neonatal HOMA-IR [n=149, Spearman rho (95% CI) =0.02 (-0.14 to 0.18), P=0.837]. Similarly, elevated maternal HOMA-IR (maternal HOMA-IR >75th percentile) was not associated with elevated neonatal HOMA-IR (neonatal HOMA-IR >75th percentile for infants is >1.19 as shown in Table 2) (McNemar X2=0.02, P=0.888).
4. Associations between maternal IR and neonatal body size and proportion
Table 3 shows that neither maternal HOMA-IR nor serum insulin correlated linearly with any of the measures of body size (birth weight, length or HC) or composition (WLR). However, maternal serum glucose was positively, albeit weakly, correlated with neonatal length z-score (r=0.2, P=0.03); a multivariable linear regression to further explore this association showed that length z-score was independently predicted by both maternal glucose (unstandardised beta [95% CI]=0.036 (0.001–0.072), t=2.036, P=0.044, R2=0.04) and weight (unstandardised beta [95% CI]=0.027 (0.01–0.24), t=2.65, P=0.009, R2=0.10) or BMI (unstandardised beta [95% CI]=0.059 [0.002–0.115], t=2.06, P=0.013, R2=0.07).
5. Comparison of neonatal body size and composition between mothers with and without elevated IR
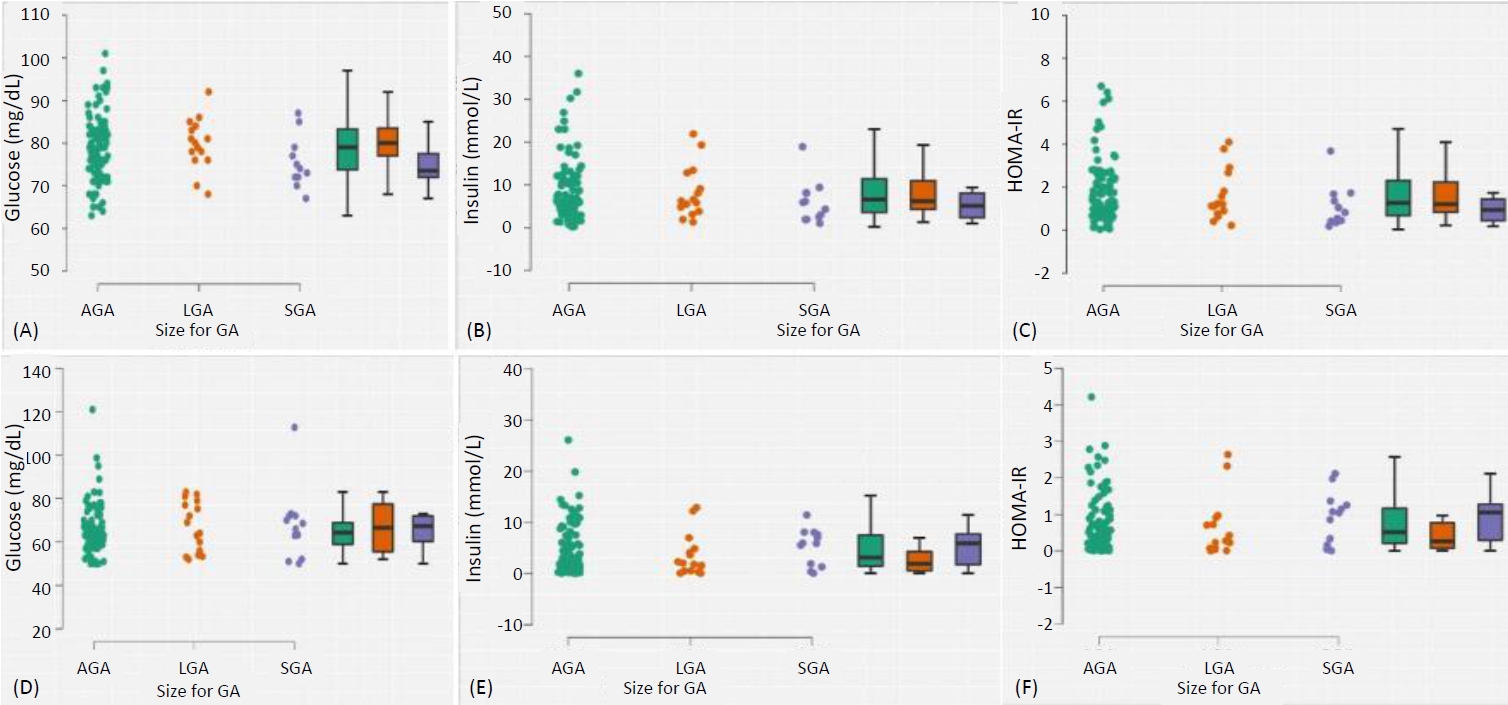
Table 4 shows that there was no significant difference in the measures of body size/composition between neonates of mothers with elevated and normal HOMA-IR. Although mothers of SGA infants had lower median serum glucose compared to mothers of LGA and AGA neonates (73.5, 80.0, 79.0 mg/dL, respectively), the differences were not significant (Kruskal-Wallis H=3.781; P=0.151) (Fig. 1A); this same pattern occurred with median serum insulin (5.01, 6.20, 6.55 μU/mL, respectively; Kruskal-Wallis H=2.03, P=0.362) (Fig. 1B) and HOMA-IR (0.93, 1.21, 1.27, respectively; H=2.555, P=0.279) (Fig. 1C). SGA infants appeared to have higher median serum glucose compared to AGA and LGA infants (67.3, 64.0, 65.6 mg/dL, respectively), but the difference was not significant (Kruskal-Wallis H=0.320, P=0.852) (Fig. 1D); a similar trend was observed for median serum insulin (5.90, 1.76, 3.06 μU/mL, respectively; H=2.212, P=0.331) (Fig. 1E) and HOMA-IR (1.05, 0.24, 0.51, respectively; H=2.405, P=0.300, respectively) (Fig. 1F).
6. Maternal and neonatal anthropometrics
Of the following maternal characteristics at enrolment – GA, weight, height, BMI, parity, age and paternal age – only weight (r=0.24, P=0.008), BMI (r=0.21, P=0.02), and parity (r=0.23, 0.012) were correlated with birth weight. A multivariable linear regression showed that birth weight was independently predicted by parity (unstandardised beta [95% CI]=94.6 [21.63–167.62], t=2.57, R2 change=0.06, P=0.012), maternal weight (unstandardised beta [95% CI]=7.89 [2.32–13.45], t=2.81, R2 change=0.05, P=0.006) and BMI (unstandardised beta [95% CI]=20.4 [5.22–35.56], t=2.66, R2 change=0.107, P=0.001). Neither maternal glucose, insulin nor HOMA-IR made a significant contribution to this model (P>0.05). Also, no maternal characteristics were associated with WLR (P>0.05).
Discussion
We used a prospective cohort design to investigate the association of IR (assessed with HOMA-IR) of 150 nondiabetic pregnant women enrolled at the late third trimester with their offspring's IR, body size and composition. We found that maternal IR was not associated with neonatal IR, body size or body composition. Rather, birth weight was independently predicted by maternal weight (birth weight increased by 8 g for every 1kg increase in maternal weight), BMI (birth weight increased by 20 g for every unit increase in maternal BMI) and parity (babies of multiparous women were 95 g heavier than those of primiparous women); while birth length z-score was independently weakly predicted by maternal glucose. Although the 150 infants were normal-sized, the respective incidences of SGA, LGA, macrosomia, stunting, wasting and IFG among them were 10.0%, 12.6%, 5.0%, 19.7% 4.2%, and 23.0%.
1. Neonatal body size and composition
Our study is one of the few to report the incidence of neonatal wasting, stunting, and IFG, as defined by the INTERGROWTH-21st Consortium [24], in relation to maternal IR. Almost onequarter (23%) of the infants were either stunted (19.7%) or wasted (4.2%); these figures are higher than the prevalence of stunting and wasting of 3.8 and 3.4%, respectively, reported by the INTERGROWTH Consortium, a multicentre, multiethnic international cohort comprising more than 60,000 infants [25]. This is concerning because, despite being from a developing country, our cohort comprised predominantly middle-to-high social class families. The INTERGROWTH-21st standards were derived from infants from 6 countries, with Africa represented only by Kenya, an East African country. Although the standards seem globally representative [27], specific validation among Nigerian newborn populations may be warranted. Our findings may have differed had we used local references such as Mokuolu et al. [28]
2. Maternal IR and neonatal IR
Our findings of no association between maternal and neonatal IR contrast with findings by Wang et al. [29] in which maternal HOMA-IR was positively associated with neonatal HOMA-IR among women with GDM and a control group of those without GDM. Similarly, another study from the United Kingdom by Maric et al. [30] found a significant association between maternal and neonatal IR among obese women who had not undergone bariatric surgery, whereas there was no significant association in a comparator group of obese women who had undergone bariatric surgery, suggesting that maternal IR may exert a weaker effect on neonatal IR in pregnant women with healthier weight profile. After careful searches, we found no other studies that evaluated the association between maternal and neonatal HOMA-IR in nondiabetic nonobese pregnant women; rather, most authors explored the association between maternal IR and infant birth weight. Our interest in the possible association of maternal and neonatal IR is because neonatal IR is a potential risk factor for later onset metabolic.
3. Maternal IR and neonatal birth size
Our finding of no association between maternal IR and birth weight agrees with a report by Bomba-Opon et al. [31] among Polish mothers and babies and a prospective study among Turkish mothers and their infants [11]. In contrast, a retrospective database review of second-to-third trimester healthy pregnant Japanese mothers by Yamashita et al. [18] found maternal HOMAIR to be positively associated with birth weight and LGA. This latter study however recruited women who, despite normal oral glucose tolerance test, had previously recorded a positive "50-g glucose challenge test," suggesting that this group of women had subtle abnormal glucose metabolism which could have affected neonatal weight and adiposity. Maternal IR is more associated with higher neonatal adiposity among pregnant women with GDM or obesity than healthier counterparts, being mediated by abnormal glucose and fat metabolism [29].
4. Maternal IR and neonatal body composition/adiposity
Generally, SGA, LGA or macrocosmic babies have higher risk of short- and long-term cardiometabolic complications and adverse outcomes compared to AGA infants [32]. Our observed LGA incidence of 12.6% was similar to 13.9% in the retrospective study by Yamashita et al. [18] among Japanese mother-neonate dyads. However, in our cohort, unlike theirs, maternal IR was not associated with the incidence of LGA. Maternal IR tends to be more predictive of macrosomia among pregnant women with GDM compared to non-GDM controls [33]. Also, previous authors, including Akinola et al. [9] among Nigerian neonates, reported that LGA infants tend to have significantly higher HOMA-IR compared to AGA or SGA infants. We did not observe significant differences in the HOMA-IR of these groups in our sample. It seems that our neonates had healthier metabolic profiles compared to the latter study; for example, our cohort's median insulin and HOMAIR were generally lower (3.1 vs. 7.1 and 0.5 vs. 1.9), perhaps also explaining the similarity of neonatal HOMA-IR among the SGA, LGA and AGA subgroups. We observed that mothers of SGA neonates had lower HOMA-IR compared to mothers of LGA and AGA infants; however, this difference was not significant; curiously, this pattern was similarly observed with serum glucose and insulin. In contrast, Mexican SGA infants had higher HOMA-IR than LGA and AGA infants [34]. This difference between their study and ours is difficult to explain, but our observation may be limited by the relatively smaller number of SGA and LGA infants in our cohort (n=12 and n=15, respectively).
5. Maternal anthropometric determinants of neonatal body size and composition
The development and evolution of IR into cardiometabolic consequences involve a complex interplay of several early-life and later-life factors that include genetics, adiposity, diet, activity, environmental exposures and others [35]. There is increasing interest in identifying early-life modifiable risk factors for preventive interventions [36]. High maternal prepregnancy weight and excessive intrapregnancy weight gain are both independent risk factors for neonatal LGA or macrosomia [37]. Although we did not measure any of these variables, previous reports [19,20]. showed that late-trimester weight greater than 95 kg is an independent predictor of maternal IR. Our study further supports the association of late-trimester maternal weight > 95 kg with birth weight. Maternal weight is thought to influence birth weight through intermediate metabolic fuels including insulin-mediated mobilisation of glucose [38] and lipids [39]. However, our data did not validate these pathways as only maternal weight and maternal glucose, insulin and HOMAIR were not associated with birth weight. Recent genomic studies suggest that obesity may not result in high birth weight in certain pregnant women with genetically determined favourable metabolic profiles [29,36,40]. Thus, our findings may not be unexpected as our cohort comprised of nondiabetic healthy singleton mothers with largely normal metabolic profiles, with few of them hyperglycaemic (8%), overweight (8%), or hyperinsulinaemic (6%) (Supplementary Table 1). This probably also accounts for the lower HOMA-IR in our study compared with others [30,35,41].
6. Reference HOMA-IR of healthy Nigerian newborn infants
The absence of universally recognised cutoff values for defining hyperinsulinaemia or IR (using HOMA-IR) often limits comparisons of studies and clinical application. Although some authors defined IR as HOMA-IR values greater than the 75th centile, this is based more on statistical descriptive distribution [34] rather than association with clinical outcomes [23]. The 75th centile for HOMA-IR among our AGA infants (1.15) was lower than the 2.60 among Mexican infants [34]. The higher value among Mexican children may partly be due to their definition of AGA as weight between 2,500–4,000 g, which is a less precise measure of weight-for-GA, compared to the use of centile-based definitions. There is a need for universal or locally derived cutoff values for HOMA-IR that are predictive of clinical outcomes or prognosis [22]. Meanwhile, we propose centile reference ranges for serum insulin and HOMA-IR for healthy Nigerian neonates.
7. Neonatal adiposity and later outcomes
A recent recommendation is that newborns' nutritional status be assessed not only with measures of their body sizes (weight, height, HC, and their categorical derivatives), but also with measures of body composition or adiposity, which are also predictive of distinct short- and long-term cardiometabolic and other outcomes [25]. Hence, identified early-life risk factors of these morbidities are potential targets for preventive measures, especially during pre- and intrapregnancy states [36]. The gold standard measure of neonatal adiposity, dual-energy x-ray absorptiometry, is not readily available, necessitating use of simpler proxies like BMI, ponderal index and WLR. Of these, WLR is the most predictive of neonatal adiposity, showing the best correlation with objectively measured neonatal fat mass [26]. However, none of the maternal anthropometric or metabolic parameters was associated with WLR in our study. This contrasted with the finding of Wang et al. [29] among Chinese pregnant women with GDM, wherein maternal HOMA-IR was associated with neonatal adiposity measured with ponderal index. As previously highlighted, the effect of maternal IR or adiposity on neonatal size or adiposity is more pronounced in the setting of the metabolic derangements associated with GDM, especially among female neonates [35,42]. We found no sex difference in neonatal outcomes including HOMA-IR, birth weight and adiposity.
8. Strengths and limitations
The strength of our study is that we explored the association of maternal IR with a wide range of measures of neonatal body size and composition, including newer measures of neonatal adiposity such as WLR. Although our cohort experienced high loss to follow-up, the smaller subcohort with neonatal data seemed remarkably representative of the larger cohort, except for family history of diabetes, which we have previously shown to not be associated with maternal IR [19], and possibly with neonatal IR. There also were many missing values among the neonatal anthropometric variables. However, the most affected variable was a factor in 96 cases, which may be large enough to mitigate the effect of missing values. We tried to minimise the effect of missing data during multivariable regression analyses to preserve sample size. Nonetheless, our neonatal cohort may have suffered from selection bias, especially with regard to the small number of SGA and LGA infants, and may not be representative of the general neonatal populations. We enrolled late third-trimester mothers on average at term, preventing evaluation of associations between earlier-trimester IR and neonatal outcomes like preterm birth.
9. Conclusion and recommendations
In this cohort of Nigerian nondiabetic healthy pregnant women followed to birth, maternal IR was not significantly associated with neonatal IR, birth weight or neonatal adiposity. The high incidence of IFG, despite the generally healthy maternal metabolic profile, suggests that other maternal nonmetabolic factors influence neonatal birth size, or that the growth chart used may be less precise for our local population. We recommend larger, preferably multicentre, prospective, cohort studies to further elucidate the effects of maternal IR on neonatal birth outcomes and longer-term outcomes, preferably with inclusion of mothers with GDM for comparison. Also, studies comparing the predictive/prognostic utility of local and international neonatal growth charts should be conducted to determine the most appropriate type.