Usefulness of glycated albumin level as a glycemic index complementing glycosylated hemoglobin in diabetic children and adolescents
Article information

Abstract
Purpose
Glycated albumin (GA) is a glycemic marker reflecting the average serum glucose of the previous 2 weeks. This study aimed to evaluate the usefulness of GA as a glycemic index to complement glycosylated hemoglobin (HbA1c) in children and adolescents.
Methods
Fifty-four children and adolescents with diabetes mellitus (DM) and 97 children and adolescents without DM (NDM) were enrolled. The correlation between mean blood glucose (MG) and GA compared to HbA1c was investigated in the DM group. The correlation between fasting glucose (FG) and GA compared to HbA1c was investigated in the NDM group. Factors affecting GA, HbA1c, and GA/HbA1c were analyzed.
Results
In the DM group, positive correlations were observed between MG and GA (P=0.003), between MG and HbA1c (P=0.001), and between GA and HbA1c (P<0.001). The correlation coefficient between MG and GA did not differ from that between MG and HbA1c in the DM group (P=0.811). Among patients with DM, those whose standardized body mass index standard deviation score (BMI SDS) was ≥2 had a lower GA/HbA1c compared with those whose BMI SDS was <2 (P=0.001). In the NDM group, there were no significant correlations between FG and GA, between FG and HbA1c, or between GA and HbA1c. The NDM subjects whose BMI SDS was ≥2 had a lower GA/HbA1c than did the NDM subjects whose BMI SDS was <2 (P=0.003).
Conclusions
GA is comparable with HbA1c in reflecting glycemic control in children and adolescents with DM. GA is affected by obesity in children and adolescents with or without DM.
Highlights
· Glycated albumin(GA) could reflect glycemic control at a comparable level as glycosylated hemoglobin in children and adolescents with diabetes mellitus (DM). The inverse correlation between GA and body mass index standard deviation score suggests that GA may be affected by obesity in children and adolescents with or without DM.
Introduction
Glycosylated hemoglobin (HbA1c) has been used as the gold standard for glycemic control and to determine the risk of chronic complications in patients with diabetes mellitus (DM) [1,2]. However, HbA1c has some limitations because it is associated with the survival of red blood cells. First, since the life span of red blood cells is approximately 120 days on average, HbA1c cannot reflect changes in blood glucose levels over a shorter period [3,4]. Second, HbA1c levels are falsely elevated or lowered in patients with blood diseases such as iron deficiency anemia, hemolytic anemia, hemorrhage, and renal anemia [4]. In addition, hyperglycemia is known to reduce the erythrocyte life span, which means that HbA1c can be underestimated in patients with poorly controlled diabetes [5].
Glycated albumin (GA) is the glycosylated product of serum albumin and reflects the average serum glucose levels for 2 to 3 weeks due to a shorter period of glucose exposure than hemoglobin [4,6]. Carbohydrate is nonenzymatically attached to the amino group (particularly intrachain lysine residues) of serum albumin to reduce serum glucose concentrations. It then undergoes structural changes, finally becoming an advanced glycation end product. These structural and functional changes are associated with diabetic complications such as retinopathy, nephropathy, and neuropathy. Serum albumin is 2–3 times more highly glycated than other serum proteins and is 10 times more sensitive to glycation than hemoglobin [7]. It has been reported that GA can accurately predict glycemic control in diabetic patients with blood diseases [8-11]. However, GA is affected by abnormal albumin metabolism status (such as nephrotic syndrome, liver cirrhosis, hyper- or hypothyroidism, and Cushing syndrome), resulting in inaccurate measurements [4,12,13].
Previous studies have shown the usefulness of GA in detecting poorly controlled DM and reflecting glucose excursion and short-term glycemic change in adults [14-17]. Adopting GA in combination with HbA1c was reported to enhance the detection of prediabetes [18,19]. However, studies on the roles of GA and the GA/HbA1c ratio as glycemic biomarkers in children and adolescents are rare, and clinical factors that influence GA in these populations are not well described [20-22].
Therefore, we aimed to evaluate the usefulness of serum GA as a glycemic index complementing HbA1c in children and adolescents with or without DM and to investigate the clinical factors affecting GA.
Materials and methods
1. Subjects
We retrospectively reviewed the medical records of children and adolescents evaluated at the Catholic University of Korea, Yeouido St. Mary's Hospital (Seoul, Korea), or Seoul St. Mary's Hospital (Seoul, Korea) between July 1, 2020, and July 31, 2021. Children and adolescents aged between 2 and 18 years who underwent tests for both GA and HbA1c were enrolled in this study. They were classified into 2 groups: the DM group included children and adolescents with type 1 (T1DM) and type 2 (T2DM) DM, while the non-DM (NDM) group included healthy children and adolescents without underlying diseases. The DM group was divided into a well-controlled DM group with an HbA1c less than 8% and a poorly controlled DM group with an HbA1c of 8% or more. The NDM group contained overweight or obese children and adolescents and normal-weight children and adolescents who presented with rapid weight gain. Patients with endocrine or chronic systemic diseases needing medication were excluded.
2. Data collection
Data on age, sex, height, weight, and waist circumference were obtained by reviewing the medical records. Body mass index (BMI) was calculated using the following formula: weight (kg)/[height (m)]2. The normative standard deviation score (SDS) for BMI was from the 2017 Korean National Growth Charts [23]. Also, laboratory values, including fasting serum glucose (FG), GA, HbA1c, GA/HbA1c ratio, cortisol, insulin, C-peptide, and lipid profiles, were evaluated. Serum GA was measured with reagents from Asahi Kasei Pharma (Lucica GA-L enzymatic assay; AKP, Tokyo, Japan) [24]. The reference range was 11%–16%, approximately 3 times higher than that of the HbA1c assay. HbA1c values measured on the nearest day to when GA was measured were selected. In patients with diabetes, the mean blood glucose (MG) levels for the previous 4 weeks were obtained through continuous glucose monitoring (CGM) data. The CGM models included the Guardian Connect CGM system (Medtronic Inc., Minneapolis, MN, USA), the Dexcom G6 CGM system (DexCom Inc., San Diego, CA, USA), and the FreeStyle Libre (Abbott, Chicago, IL, USA), which are available in South Korea.
3. Statistical analysis
All results are expressed as means±standard deviations. Differences in continuous variables between the groups were analyzed using an independent t-test. Differences in categorical variables were analyzed using chi-square and Fisher exact tests. Pearson correlation coefficients were calculated to examine the relationships between the continuous variables. Hotelling T-square test was used to compare the correlation coefficients. A P-value <0.05 was considered statistically significant. Statistical analyses were performed using PASW Statistics ver.18 software (SPSS Inc., Chicago, IL, USA).
4. Ethical statement
The study was approved by the Institutional Review Board of Yeouido St. Mary's Hospital of Catholic University (IRB No. SC22RIDI0080). The study was approved by the Institutional Review Board of Seoul St. Mar y's Hospital of Catholic University (IRB No. KC22RIDI0576).
Results
1. Baseline characteristics and glycemic biomarkers of the subjects
Of the 151 children and adolescents (age 12.5±3.8 years, male 59.6%) enrolled in this study, 54 were included in the DM group and 97 in the NDM group (Table 1). In the DM group, 24 patients (44.4%) had T1DM, and 30 (55.5%) had T2DM. Data collected through the CGM system were obtained from 20 patients (37%) in the DM group, 18 (90%) of whom had T1DM.
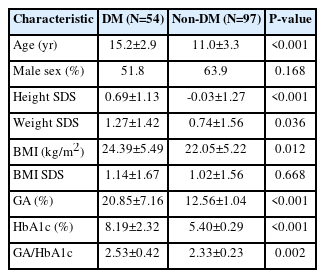
Baseline characteristics and glycemic biomarkers of the subjects
There was no difference in sex (P=0.168) and BMI SDS (P=0.668) between the DM and the NDM groups. GA and HbA1c levels of the DM group were significantly higher than those of the NDM group (20.85%±7.16% vs. 12.56%±1.04% and 8.19%±2.32% vs. 5.40%±0.29%, respectively; P<0.001) (Table 1). In addition, the GA/HbA1c ratio of the DM group was significantly higher than that of the NDM group (2.53±0.42 vs. 2.33±0.23, P=0.002).
To analyze the difference in the GA/HbA1c ratio according to the glycemic control status in patients with diabetes, the patients in the DM group were subdivided into 2 groups: HbA1c <8% and ≥8% (Table 2). There was no difference in the GA/HbA1c ratio according to the glycemic control status (2.54±0.43 vs. 2.52±0.42, P=0.812). GA and HbA1c did not differ between patients with T1DM and those with T2DM. Patients with T1DM had a higher GA/HbA1c ratio compared to those with T2DM (2.85±0.31 vs. 2.28±0.32, P<0.001) (Table 2).
Baseline characteristics and glycemic biomarkers of patients with diabetes mellitus
2. The correlation between glycemic biomarkers
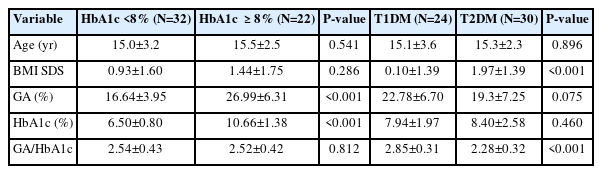
In the DM group, positive correlations were observed between MG and GA (r=0.636, P=0.003, Fig. 1A) and between MG and HbA1c (r=0.716, P=0.001, Fig. 1A). The correlation coefficient between MG and GA did not differ from that between MG and HbA1c (P=0.811). In the DM group, GA correlated positively with HbA1c (r=0.860, P<0.001, Fig. 1A).
The correlations between glycemic biomarkers in patients with diabetes mellitus (DM; A) and non-DM (B) subjects. GA, glycated albumin; HbA1c, glycated hemoglobin
In the NDM group, no correlation was observed between FG and GA (r=0.110, P=0.284), between FG and HbA1c (r=0.089, P=0.385), or between GA and HbA1c (r=-0.040, P=0.700) (Fig. 1B).
3. The correlations between BMI SDS and HbA1c, GA, and GA/HbA1c ratio
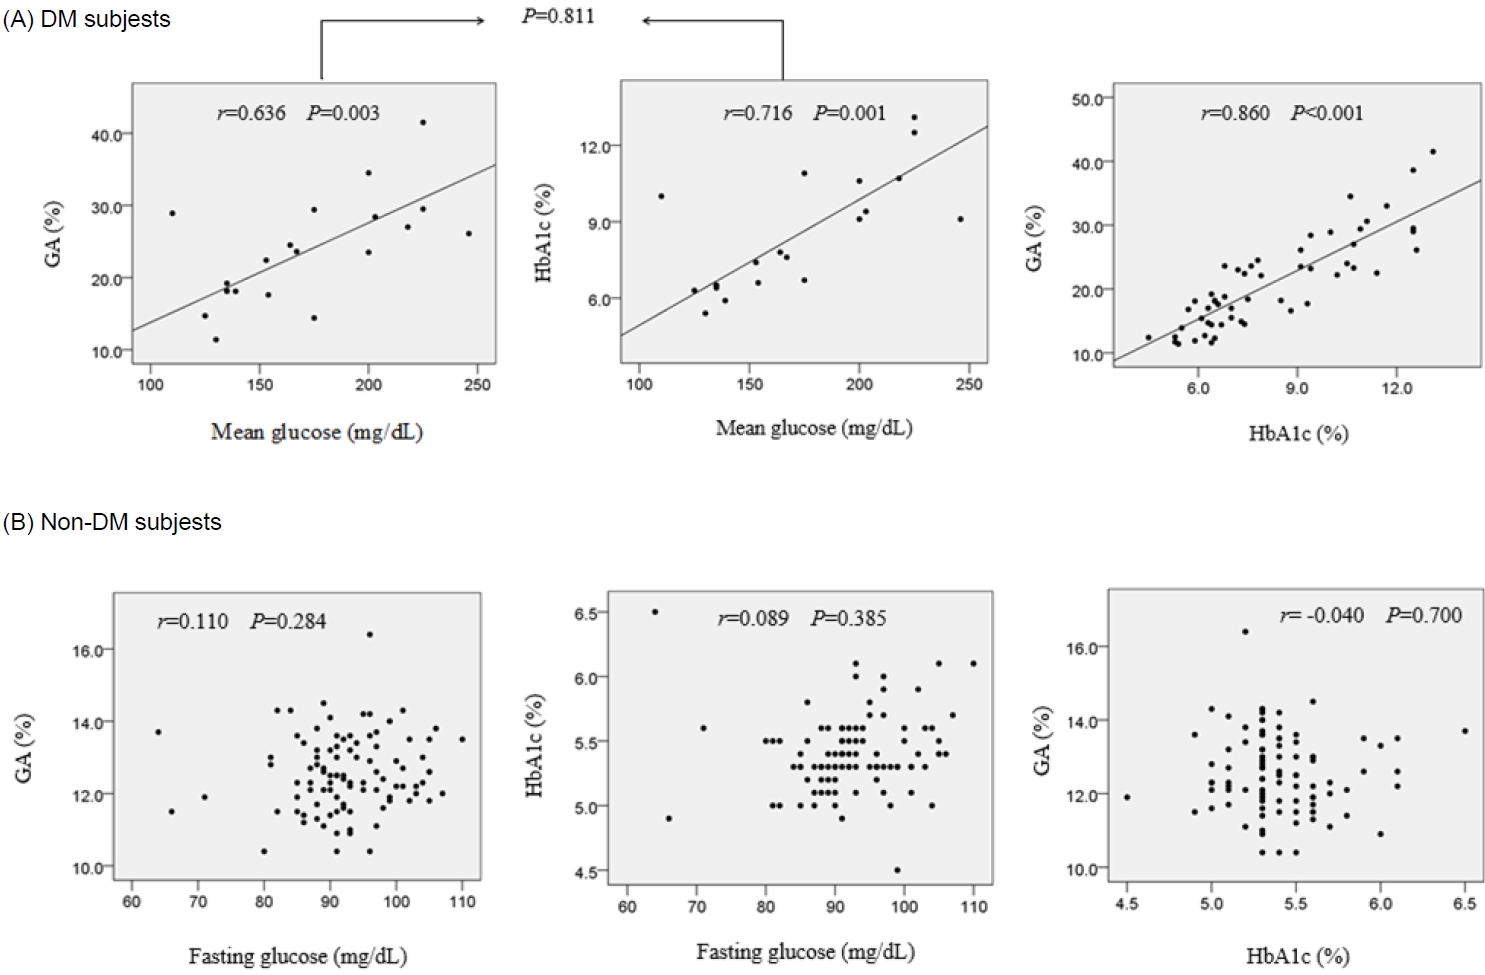
In the DM group, both GA (r=-0.269, P=0.049) and the GA/HbA1c ratio (r=-0.628, P<0.001) correlated negatively with BMI SDS (Fig. 2A). Meanwhile, HbA1c showed no correlation with BMI SDS (r=0.054, P=0.697).
The correlations between BMI SDS and HbA1c, GA, and GA/HbA1c ratio in patients with diabetes mellitus (A; DM) and non-DM (B) subjects. HbA1c, glycated hemoglobin; GA, glycated albumin; BMI, body mass index; SDS, standard deviation score.
In the NDM group, both GA (r=-0.355, P<0.001) and GA/HbA1c ratio (r=-0.412, P<0.001) correlated negatively with BMS SDS (Fig. 2B). Meanwhile, HbA1c showed a positive correlation with BMI SDS (r=0.217, P=0.033).
4. The levels of GA, HbA1c, and GA/HbA1c ratio according to the presence of obesity
In the DM group, patients with BMI SDS ≥2 had a lower GA/HbA1c ratio than patients with BMI SDS <2 (2.21±0.39 vs. 2.66±0.37, P=0.001) (Supplementary Fig. 1A). GA and HbA1c did not differ between the subgroups according to BMI SDS (P=0.063 and P=0.885, respectively).
In the NDM group, subjects with BMI SDS ≥2 had a lower GA (12.11±1.04 vs. 12.78±0.98, P=0.004) (Supplementary Fig. 1B) and GA/HbA1c ratio (2.23±0.22 vs. 2.38±0.22, P=0.003) (Supplementary Fig. 1B) in comparison with subjects with BMI SDS <2. HbA1c did not differ between the subgroups according to BMI SDS (P=0.401) (Supplementary Fig. 1B).
Discussion
This study showed that GA could reflect glycemic control at a comparable level as HbA1c in children and adolescents with DM. Additionally, increased BMI SDS correlates with lower GA, which needs to be considered when diagnosing prediabetes and DM or assessing the risk of diabetic complications. Meanwhile, the GA/HbA1c ratio does not reflect glycemic control in those populations. Therefore, this study delineated the usefulness and limitations of GA in children and adolescents.
The strength of this study is that the mean blood glucose (MG) levels obtained using the CGM system were adopted to compare glycemic indices. When the correlation coefficient between MG and GA was compared with that between HbA1c and MG among the same patients with DM, there was no statistical difference. This indicates that GA and HbA1c are comparable in their ability to reflect glycemic control in diabetes. To expand our understanding of the usability of GA in patients wearing a CGM system, future studies need to enroll larger numbers of patients and include more factors other than MG, such as glucose excursion or proportion of glucose levels within target ranges.
An inverse correlation between GA and BMI SDS, found in the present study, was also reported in previous studies of children and adults [25-27]. On the other hand, a report found no correlation between BMI and GA in adults with T1DM and T2DM but a negative correlation between BMI and GA/HbA1c ratio in patients with T2DM [15]. In the present study, an inverse correlation between GA/HbA1c and BMI SDS was not observed in patients with T1DM in contrast to those with T2DM (data not shown). This finding needs more exploration because most patients with T1DM included in the present study had BMI SDS within the normal range. The mechanism of the negative influence of obesity on GA remains unclear. It was postulated that chronic inflammation in obesity causes an increase in the albumin catabolic rate and a decrease in albumin synthesis [28,29]. In addition, it was suggested that hyperinsulinemia induced by visceral obesity could accelerate albumin turnover [27,30]. Further studies are required to investigate the relationship between fat mass and GA (or GA/HbA1c ratio) in obese children and adolescents.
We found no correlation between GA and FG in NDM subjects. This provides evidence that GA levels are stable and reflect euglycemia correctly in healthy children and adolescents without DM. The GA/HbA1c ratio was significantly higher in the DM group than in the NDM group. A possible explanation is that the change in GA in response to the elevation of serum glucose was greater than the change in HbA1c in response to the elevation of serum glucose. Additionally, the underestimated HbA1c value by hyperglycemia could affect the result. However, there was no difference in the GA/HbA1c ratio between the poorly controlled and well-controlled subgroups of patients with DM based on the HbA1c 8% cutoff. Our interpretation of this finding is that the GA/HbA1c ratio does not reflect the glycemic control status in patients with diabetes but does reflect the glycemic variability over the previous 2 weeks compared to the previous 3 months.
In the DM group, the GA/HbA1c ratio was higher in patients with T1DM than in those with T2DM. A disparity in the GA levels compared to the HbA1c levels according to the type of DM was reported in a previous study [15]. There was no difference in acute glycemic change between the T1DM and T2DM groups, so the difference in the GA/HbA1 does not reflect recent glycemic variability. As the BMI negatively correlated with the GA/HbA1c ratio in the patients with T2DM, it could be interpreted that higher BMI in patients with T2DM might affect the production of GA, resulting in a lower GA/HbA1c ratio. Studies have reported the clinical significance of the GA/HbA1c ratio [4,31], which has been suggested to reflect insulin secretory function [17,32,33], act as an index for diagnosing fulminant T1DM [34], and function as an indicator for diabetic nephropathy and retinopathy in T2DM [35-37].
The merits of HbA1c as a glycemic biomarker include its ample clinical evidence and strong correlations with the risks of diabetic complications [1,2]. The advantages of GA over HbA1c include its applicability in patients with blood disorders and accurate reflections of intermediate-term glycemic control. In addition, recent studies reported that GA reflects glycemic variability better than HbA1c in patients with diabetes [22]. It has been suggested that glucose variability, independent of HbA1c, plays a significant role in the risk for microvascular complications of DM [38]. The hypothesized mechanism by which GA reflects glucose excursion better than HbA1c is that large glucose fluctuation could increase glycation and oxidation of albumin [14,17]. In contrast, large glucose fluctuation is known to decrease the survival of hemoglobin, and measured HbA1c is underestimated during hyperglycemia [3,5]. Based on previous reports, a combination of GA, HbA1c, and data from the CGM system could lead to a better estimation of the risk for diabetic complications.
Recently, the indications for testing GA in adults have widened [6]. GA is currently useful as a marker in gestational DM [39], in situations of earlier therapeutic adjustment [40], or in cases where postprandial glucose excursion is large [41]. More evidence that GA has significant roles as a glycemic marker in children and adolescents might help broaden the indications of GA measurement in these populations.
This study had some limitations. First, the study was designed retrospectively. Second, it was not possible to evaluate the influence of age or degree of pubertal development. Third, the data using the CGM system were only obtained from part of the DM cohort, the majority of whom had T1DM. The MG levels reflect data from the previous 4 weeks and were not consistent with the half-life of GA and HbA1c. In addition, the data using the CGM system reflect the glucose level in the interstitial fluid, which may be different from the serum glucose level. Fourth, the analysis did not include the association between glycemic variability and glycemic biomarkers. Last, we could not determine cutoff values of GA and GA/HbA1c ratio representing clinical importance.
In conclusion, the usefulness of GA is comparable with that of HbA1c in reflecting glycemic control in children and adolescents with DM. GA is markedly affected by obesity in children and adolescents with or without DM. Large-scale prospective studies are needed to investigate the clinical usability of GA and, by incorporating data from the CGM system, the relationship of glycemic biomarkers with glycemic variability in children and adolescents.
Supplementary Material
Supplementary Fig. 1 can be found via https://doi.org/10.6065/apem.2244202.101.
The levels of GA, HbA1c, and GA/HbA1c ratio according to the presence of obesity in patients with DM (A) and non-DM (B) subjects. DM, diabetes mellitus; GA, glycated albumin; HbA1c, glycated hemoglobin; BMI, body mass index; SDS, standard deviation score.
Notes
Conflicts of interest
No potential conflict of interest relevant to this article was reported.
Funding
This study received no specific grant from any funding agency in the public, commercial, or not-for-profit sectors.
Data availability
The data that support the findings of this study can be provided by the corresponding author upon reasonable request.
Author contribution
Conceptualization: MHJ, BKS; Data curation: YJC, NYL, MBA, MHJ; Formal analysis: YJC, MHJ; Methodology: YJC, NYL, MBA, MHJ, BKS; Project administration: MBA, MHJ; Visualization: YJC; Writing - original draft: YJC; Writing - review & editing: YJC, NYL, MBA, SHK, WKC, KSC, MHJ, BKS