Ann Pediatr Endocrinol Metab Search

CLOSE


Ann Pediatr Endocrinol Metab > Volume 20(1); 2015 > Article
Son, Yoo, Kwak, Park, Kim, Chung, Chae, Kim, and Kim: Regression and progression of microalbuminuria in adolescents with childhood onset diabetes mellitus

Abstract

Purpose

Although microalbuminuria is considered as an early marker of nephropathy in diabetic adults, available information in diabetic adolescents is limited. The aim of this study was to investigate prevalence and frequency of regression of microalbuminuria in type 1 (T1DM) and type 2 diabetes mellitus (T2DM) patients with childhood onset.

Methods

One hundred and nine adolescents (median, 18.9 years; interquartile range (IQR), 16.5-21.0 years) with T1DM and 18 T2DM adolescents (median, 17.9 years; IQR, 16.8-18.4 years) with repeated measurements of microalbuminuria (first morning urine microalbumin/creatinine ratios) were included. The median duration of diabetes was 10.1 (7.8-14.0) years and 5.0 (3.5-5.6) years, respectively, and follow-up period ranged 0.5-7.0 years. Growth parameters, estimated glomerular filtration rate, glycosylated hemoglobin (HbA1c) and lipid profiles were obtained after reviewing medical record in each subject.

Results

The prevalence of microalbuminuria at baseline and evaluation were 21.1% and 17.4% in T1DM, and 44.4% and 38.9% in T2DM. Regression of microalbuminuria was observed in 13 T1DM patients (56.5%) and 3 T2DM patients (37.5%), and progression rate was 10.5% and 20% in T1DM and T2DM respectively. In regression T1DM group, HbA1c at baseline and follow-up was lower, and C-peptide at baseline was higher compared to persistent or progression groups. In T2DM, higher triglyceride was observed in persistent group.

Conclusion

Considerable regression of microalbuminuria more than progression in diabetes adolescents indicates elevated urinary microalbumin excretion in a single test does not imply irreversible diabetic nephropathy. Careful monitoring and adequate intervention should be emphasized in adolescents with microalbuminuria to prevent rapid progression toward diabetic nephropathy.

Introduction

Microalbuminuria is known as an early marker of nephropathy and cardiovascular diseases in adults with diabetes1,2,3,4) and hypertension5). In patients with childhood onset diabetes, the cumulative prevalence of microalbuminuria is about 25%-30% after 10 years of diabetes, and 40%-60% after 20 years of diabetes6,7). International Society for Pediatric and Adolescent Diabetes, The American Diabetes Association and National Kidney Foundation recommend annual screening for microalbuminuria in children from 9 years of age with 5 years of insulin dependent diabetes mellitus (IDDM) duration, from 11 years of age with 2 years of IDDM duration, and adolescent with 2 years or more of IDDM duration8,9).
Regression of microalbuminuria was reported in type 1 diabetes adults that occurred in 58% of the patients with a 6-year cumulative incidence of microalbuminuria, and modifiable factors were low glycosylated hemoglobin (HbA1c) levels, low blood pressure and low levels of lipid concentration10). Regression of microalbuminuria over six years was also occurred in 31% of adults with type 1 diabetes in Denmark11). In a pediatric study conducting type 1 diabetic children, cumulative incidence of microalbuminuria was 26% after 10 years of follow-up, of them 39% had regression to normoalbuminuria without recurrence6).
It was also reported that 72% of type 1 diabetic children had regression to normoalbuminuria using repeated random spot urine tests in a single center study12). Therefore there is a focus on early detection and prevention of complications through routine screening and careful monitoring as well as adequate control of blood glucose and blood pressure in diabetic children12).
In this study, we investigated prevalence and frequency of regression of microalbuminuria in adolescents with childhood onset type 1 (T1DM) and type 2 diabetes mellitus (T2DM).

Materials and methods

1. Subjects

A total of 127 patients (83 males and 44 females, 8-28 years) with childhood onset T1DM or T2DM, who visited department of pediatrics, Konkuk University Medical Center and Childhood Diabetes Clinic of Severance Children's Hospital were included from July 2007 to July 2014. One hundred and nine patients were T1DM and 18 patients were T2DM. Diabetic patients with macroalbuminuria or overt proteinuria, hematuria, menstrual bleeding, infections, fever, and other renal diseases were excluded. Confirmed cases of diabetic nephropathy treated with medication were also excluded in this study.

2. Anthropometric and laboratory data measurements

Height and body weight were measured with a stadiometer and a calibrated digital electric scale, and body mass index (BMI) was calculated in each subject. The z-scores of height, weight, and BMI were obtained by Lambda-Mu-Sigma (LMS) method3,13). Serum creatinine, HbA1c, C-peptide and lipid profiles were obtained. Estimated glomerular filtration rate (eGFR) was calculated using the Schwartz formula: eGFR (mL/min/1.73 m2)=κ×height (cm)/serum creatinine (mg/dL)14). The value of κ was determined to be 0.55 for children aged between 2 and 13 years and adolescent girls, and 0.70 for adolescent boys.
First morning urine sample was obtained in all patients, with an average of 2.7 urine samples per a patient. Three or more urine samples were collected in 24.4% and 2 samples collected in 75.6% of the patients. Baseline was the time of initial measurement of microalbuminuria, not meant by the time of diagnosis as diabetes. Follow-up was the time of last measurement of microalbuminuria. Spot urine microalbumin/creatinine ratio (mg/g) was measured by the Jaffe method, and microalbuminuria is defined as 30-300 mg/g of microalbumin/creatinine ratio in spot urine15). Persistent microalbuminuria was defined as the presence of microalbuminuria at baseline and follow up assessment. Regressed or transient microalbuminuria was defined as regression of microalbuminuria to normoalbuminuria during follow-up. Progression of microalbuminuria was defined as normoalbuminuria at baseline assessment followed by progression to microalbuminuria6).
Medical record was reviewed retrospectively in each patient.

3. Ethics and confidential data approvals

This study was approved by the Institutional Review Board of Konkuk University Medical Center, Seoul, Korea (IRB No. KUH1090029).

4. Statistical data analysis

Data are expressed as median (interquartile range [IQR] or range), or number and proportion (%). Standard descriptive statistics were used to summarize demographic and laboratory variables. Changes in variables between baseline and follow-up were tested using the Wilcoxon signed-rank test. Mann-Whitney U test was used to compare between two groups, and Kruskal Wallis analysis of variance was used for multiple comparison. Statistical analyses were performed using IBM SPSS Statistics ver. 20.0 (IBM Co., Armonk, NY, USA). All reported P-values are two-tailed and P-values less than 0.05 were considered statistically significant.

Results

One hundred and nine patients were T1DM (39 males and 70 females) and 18 patients were T2DM (4 males and 14 females). The median duration of diabetes was 10.1 years and 5.0 years, respectively (Table 1). Both T1DM and T2DM groups had shown the changes of anthropometric indexes between baseline and follow-up tests. In T2DM, BMI z-score had shown decreasing tendency, but there was no statistical significance. The median spot urine microalbumin/creatinine ratios at baseline and follow-up were 9.4 mg/g (IQR, 6.3-26.6 mg/g) and 13.3 mg/g (IQR, 8.6-24.8 mg/g) in T1DM, and 25.3 mg/g (IQR, 11.5-56.0 mg/g) and 17.7 mg/g (IQR, 6.2-42.0 mg/g) in T2DM, but there were no statistical significance. The other profiles include HbA1c shown no statistical significance.
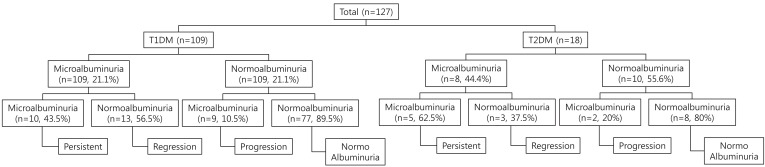
The prevalence of microalbuminuria at baseline and follow up were 21.1% and 17.4% in T1DM, and 44.4% and 38.9% in T2DM (Fig. 1). Patients were divided into 4 groups based on results of repeated microalbuminuria measurements; persistent, regression, progression of microalbuminuria and normoalbuminuria groups. In 109 T1DM patients, 23 patients had microalbuminuria at baseline, of them 13 (56.5%) had regression of microalbuminuria, 10 (43.5%) had persistent microalbuminuria, and 86 patients had no microalbuminuria at baseline, of them 9 (10.5%) showed progression of microalbuminuria during follow-up period. In 18 T2DM patients, 3 (37.5%) had regression of microalbuminuria, 5 (62.5%) had persistent microalbuminuria, and 2 (20.0%) had progression of microalbuminuria. Seventy-seven patients (89.5%) in T1DM and 8 patients (80.0%) in T2DM had negative results of microalbuminuria during follow-up.
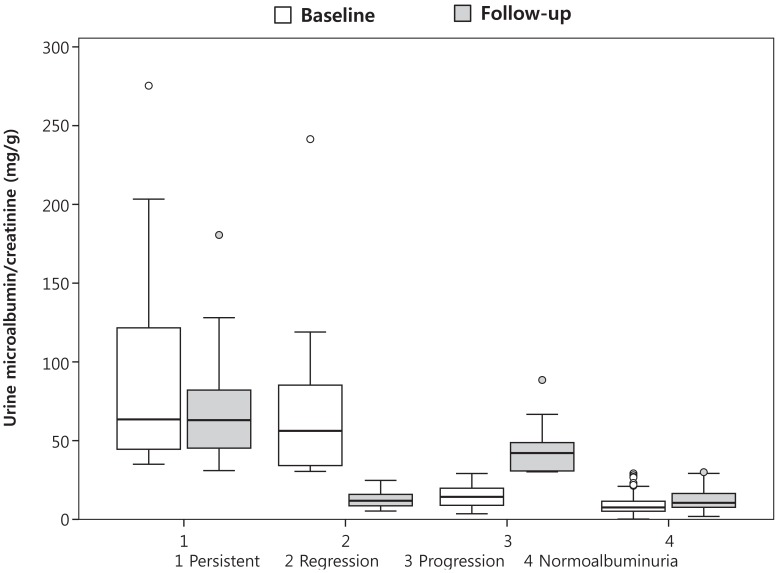
Clinical characteristics and laboratory parameters of T1DM and T2DM patients were compared among persistent, regression, progression, and normoalbuminuria groups (Tables 2,3). The duration of diabetes was not different among 4 groups in T1DM (P=0.353 at baseline, P=0.455 at follow-up). In T2DM, no difference of duration of diabetes was also observed among 4 groups at baseline (P=0.861), and at follow-up (P=0.366). In T1DM, follow-up duration of microalbuminuria was longer in regression group compared to persistent (P<0.001) or progression groups (P=0.027). HbA1C at baseline (P=0.009) and follow-up (P=0.030) was lower in regression group compared to persistent or progression groups. C-peptide at baseline was higher in regression group compared to persistent group (P=0.021). In T2DM, there was no significant difference between each group in anthropometric indexes except baseline height z-score (P=0.014). And higher triglyceride (TG) was observed at both baseline (P=0.040) and follow up (P=0.012) in persistent group. Follow-up duration of microalbuminuria was not different significantly among T2DM groups (P=0.297). Comparison of spot urine microalbumin/creatinine ratio between baseline and follow up was presented in Fig. 2.

Discussion

The prevalence of microalbuminuria at baseline and follow-up were 21.1% and 17.4% in T1DM, and 44.4% and 38.9% in T2DM. The regression of microalbuminuria was observed in 56.5% of T1DM patients and 37.5% of T2DM patients during follow-up. Lower baseline HbA1c (persistent vs. regression, P=0.026; progression vs. regression, P=0.057), higher C-peptide at baseline (persistent vs. regression, P=0.021) was observed in T1DM regression group compared to those in persistent or progression groups. In T2DM, patients in persistent group had higher TG compared to patients in other groups (baseline, P=0.040; follow-up, P=0.012).
While microalbuminuria was considered as a predictor of diabetic nephropathy in both adults and children2,3,16), there have been studies which described regression of microalbuminuria in diabetic patients6,7,10,12,17,18,19). Perkins et al.10) found frequent regression of microalbuminuria, with 58% (95% confidence interval, 52-64) incidence at the 6-year follow-up in T1DM adult patients. Low HbA1c, low blood pressure and low levels of lipid profiles were identified as modifiable factors. In the European multicenter study, 50.6% of T1DM patients showed regression of microalbuminuria, whereas 13.9% showed progression over 7.3 years20). In the Oxford regional prospective study, the cumulative prevalence of microalbuminuria was 25.7% and 50.7% after 10 and 19 years of diabetes, of them 39% regressed to normoalbuminuria, while 13.9% progressed to macroalbuminuria6). Modifiable predictors of macroalbuminuria were high HbA1c, and persistent and intermittent microalbuminuria. It was also reported that 72% of T1DM children had regression to normoalbuminuria using repeated spot urine tests in a single center study12).
In patients with T2DM, microalbuminuria might be an early marker of T2DM, and it could precede a diagnosis of T2DM21,22). Therefore, it was recommended for patients with T2DM to be screened for microalbuminuria at the beginning of diagnosis because the course of renal dysfunction is more heterogeneous, and the progression of nephropathy is less well characterized compared to that of T1DM17,23). Moreover, the effect of medical treatment on diabetic nephropathy in T2DM has not been fully investigated. Until now, microalbuminuria in T2DM patients has been considered the first step toward overt proteinuria and nephropathy17). However, recent studies reported that microalbuminuria in T2DM could be improved to normoalbuminuria17,24). Araki et al.24) found frequent remission and/or regression, with about 50% incidence at the 6-year follow-up in T2DM adult patients. Short duration of microalbuminuria, the use of renin-angiotensin system blocking drugs, low HbA1c and low systolic blood pressure were identified as determinants. Gaede et al.25) have reported that 30.5% of T2DM patients with microalbuminuria achieved remission to normoalbuminuria during 3-8 years, and antihypertensive therapy and low HbA1c were independent predictors for remission. In Japanese pediatric study, they presented that only 20% of children progressed to overt proteinuria, whereas 40% of children improved to normoalbuminuria among 130 T2DM patients with microalbuminuria during the follow-up years (mean±stdndard deviation, 3.4±1.3 years; range, 2-6 years)17). Female sex, high HDL cholesterol and low HbA1c were independently associated with remission and/or regression of microalbuminuria. In this study, we identified frequent regression of microalbuminuria in 56.5% of T1DM and 37.5% of T2DM patients with a short follow-up period, which is consistent with previous studies6,10,11,12,17,24). Duration of microalbuminuria, HbA1c, blood pressure, lipid concentration and use of renin-angiotensin system blocking agents were well known risk factors of microalbuminuria26). We found lower HbA1c and higher C-peptide at baseline in regression group of T1DM, and higher TG in T2DM persistent group. It means that adequate control of glucose and lipid concentrations is important in diabetic children and adolescents, consistent with previous studies6,10,13,18,27,28,29). Duration of microalbuminuria follow-up was longer in T1DM regression group compared to persistent or progression groups, while duration of diabetes did not differ among subgroups. It suggests the importance of frequent monitoring for microalbuminuria in diabetic children and adolescents. Early detection of microalbuminuria may lead to adequate intervention and, as a result, prevent progression toward diabetic nephropathy.
Our study has limitations. First, retrospective nature of study design is a limitation. Second, although important clinical and laboratory determinants of microalbuminuria were measured in the present study, other affecting factors such as blood pressure, sodium intake, and the use of angiotensin converting enzyme inhibitors or angiotensin receptor blocker were not included as a variable. Third, small sample size and short follow-up period is another limitation. During annual or biannual screening of microalbuminuria according to clinical practice guideline, frequent regression of microalbuminuria in both T1DM and T2DM patients was observed9). Further studies including large number of childhood onset diabetes patients with long term follow-up period should be followed to identify contributing factors and mechanism of progression to overt proteinuria. Elevated microalbumin excretion is known to be an early marker of progression to diabetic nephropathy, however regression of microalbuminuria was observed in substantial number of patient. It indicates elevated urinary microalbumin excretion in a single test does not imply irreversible diabetic nephropathy. Close monitoring and intensive control should be emphasized in children and adolescents with microalbuminuria to prevent or delay the progression of diabetic nephropathy.

Notes

Conflict of interest: No potential conflict of interest relevant to this article was reported.

References

1. de Jong PE, Curhan GC. Screening, monitoring, and treatment of albuminuria: Public health perspectives. J Am Soc Nephrol 2006;17:2120–2126. PMID: 16825331.
crossref pmid
2. Gerstein HC, Mann JF, Yi Q, Zinman B, Dinneen SF, Hoogwerf B, et al. Albuminuria and risk of cardiovascular events, death, and heart failure in diabetic and nondiabetic individuals. JAMA 2001;286:421–426. PMID: 11466120.
crossref pmid
3. Allen KV, Walker JD. Microalbuminuria and mortality in long-duration type 1 diabetes. Diabetes Care 2003;26:2389–2391. PMID: 12882867.
crossref pmid
4. Bangstad HJ, Osterby R, Dahl-Jorgensen K, Berg KJ, Hartmann A, Nyberg G, et al. Early glomerulopathy is present in young, type 1 (insulin-dependent) diabetic patients with microalbuminuria. Diabetologia 1993;36:523–529. PMID: 8335174.
crossref pmid
5. Ibsen H, Wachtell K, Olsen MH, Borch-Johnsen K, Lindholm LH, Mogensen CE, et al. Albuminuria and cardiovascular risk in hypertensive patients with left ventricular hypertrophy: the LIFE Study. Kidney Int Suppl 2004;(92):S56–S58. PMID: 15485419.
crossref
6. Amin R, Widmer B, Prevost AT, Schwarze P, Cooper J, Edge J, et al. Risk of microalbuminuria and progression to macroalbuminuria in a cohort with childhood onset type 1 diabetes: prospective observational study. BMJ 2008;336:697–701. PMID: 18349042.
crossref pmid pmc
7. Kwon AR, Lee S, Chae HW, Kim DH, Kim HS. Frequencies and related factors for microvascular complications in patients with type 1 diabetes. Ann Pediatr Endocrinol Metab 2012;17:16–26.
crossref
8. Farmer AJ, Stevens R, Hirst J, Lung T, Oke J, Clarke P, et al. Optimal strategies for identifying kidney disease in diabetes: properties of screening tests, progression of renal dysfunction and impact of treatment - systematic review and modelling of progression and cost-effectiveness. Health Technol Assess 2014;18:1–128. PMID: 24576414.
crossref pmid pmc pdf
9. Donaghue KC, Wadwa RP, Dimeglio LA, Wong TY, Chiarelli F, Marcovecchio ML, et al. Microvascular and macrovascular complications in children and adolescents. Pediatr Diabetes 2014;15(Suppl 20):257–269. PMID: 25182318.
crossref
10. Perkins BA, Ficociello LH, Silva KH, Finkelstein DM, Warram JH, Krolewski AS. Regression of microalbuminuria in type 1 diabetes. N Engl J Med 2003;348:2285–2293. PMID: 12788992.
crossref pmid
11. Hovind P, Tarnow L, Rossing P, Jensen BR, Graae M, Torp I, et al. Predictors for the development of microalbuminuria and macroalbuminuria in patients with type 1 diabetes: inception cohort study. BMJ 2004;328:1105. PMID: 15096438.
crossref pmid pmc
12. Montgomery KA, Ratcliffe SJ, Baluarte HJ, Murphy KM, Willi S, Lipman TH. Implementation of a clinical practice guideline for identification of microalbuminuria in the pediatric patient with type 1 diabetes. Nurs Clin North Am 2013;48:343–352. PMID: 23659818.
crossref pmid
13. Steinke JM, Sinaiko AR, Kramer MS, Suissa S, Chavers BM, Mauer M, et al. The early natural history of nephropathy in Type 1 Diabetes: III. Predictors of 5-year urinary albumin excretion rate patterns in initially normoalbuminuric patients. Diabetes 2005;54:2164–2171. PMID: 15983218.
crossref pmid
14. Bogdanovic R. Diabetic nephropathy in children and adolescents. Pediatr Nephrol 2008;23:507–525. PMID: 17940807.
crossref pmid
15. Bennett PH, Haffner S, Kasiske BL, Keane WF, Mogensen CE, Parving HH. Screening and management of microalbuminuria in patients with diabetes mellitus: recommendations to the Scientific Advisory Board of the National Kidney Foundation from an ad hoc committee of the Council on Diabetes Mellitus of the National Kidney Foundation. Am J Kidney Dis 1995;25:107–112. PMID: 7810516.
crossref pmid
16. Dinneen SF, Gerstein HC. The association of microalbuminuria and mortality in non-insulin-dependent diabetes mellitus. A systematic overview of the literature. Arch Intern Med 1997;157:1413–1418. PMID: 9224218.
crossref pmid
17. Ono T, Shikata K, Obika M, Miyatake N, Kodera R, Hirota D, et al. Factors associated with remission and/or regression of microalbuminuria in type 2 diabetes mellitus. Acta Med Okayama 2014;68:235–241. PMID: 25145409.
pmid
18. Salardi S, Balsamo C, Zucchini S, Maltoni G, Scipione M, Rollo A, et al. High rate of regression from micromacroalbuminuria to normoalbuminuria in children and adolescents with type 1 diabetes treated or not with enalapril: the influence of HDL cholesterol. Diabetes Care 2011;34:424–429. PMID: 21216861.
crossref pmid pmc
19. Svensson M, Eriksson JW, Dahlquist G. Early glycemic control, age at onset, and development of microvascular complications in childhood-onset type 1 diabetes: a population-based study in northern Sweden. Diabetes Care 2004;27:955–962. PMID: 15047655.
crossref pmid
20. Giorgino F, Laviola L, Cavallo Perin P, Solnica B, Fuller J, Chaturvedi N. Factors associated with progression to macroalbuminuria in microalbuminuric Type 1 diabetic patients: the EURODIAB Prospective Complications Study. Diabetologia 2004;47:1020–1028. PMID: 15170497.
crossref pmid
21. Alberti KG, Zimmet PZ. Definition, diagnosis and classification of diabetes mellitus and its complications. Part 1: diagnosis and classification of diabetes mellitus provisional report of a WHO consultation. Diabet Med 1998;15:539–553. PMID: 9686693.
crossref pmid
22. Maahs DM, Snively BM, Bell RA, Dolan L, Hirsch I, Imperatore G, et al. Higher prevalence of elevated albumin excretion in youth with type 2 than type 1 diabetes: the SEARCH for Diabetes in Youth study. Diabetes Care 2007;30:2593–2598. PMID: 17630264.
crossref pmid
23. Gambara V, Mecca G, Remuzzi G, Bertani T. Heterogeneous nature of renal lesions in type II diabetes. J Am Soc Nephrol 1993;3:1458–1466. PMID: 8490117.
crossref pmid
24. Araki S, Haneda M, Sugimoto T, Isono M, Isshiki K, Kashiwagi A, et al. Factors associated with frequent remission of microalbuminuria in patients with type 2 diabetes. Diabetes 2005;54:2983–2987. PMID: 16186402.
crossref pmid
25. Gaede P, Tarnow L, Vedel P, Parving HH, Pedersen O. Remission to normoalbuminuria during multifactorial treatment preserves kidney function in patients with type 2 diabetes and microalbuminuria. Nephrol Dial Transplant 2004;19:2784–2788. PMID: 15328385.
crossref pmid pdf
26. Roett MA, Liegl S, Jabbarpour Y. Diabetic nephropathy: the family physician's role. Am Fam Physician 2012;85:883–889. PMID: 22612183.
pmid
27. Stone ML, Craig ME, Chan AK, Lee JW, Verge CF, Donaghue KC. Natural history and risk factors for microalbuminuria in adolescents with type 1 diabetes: a longitudinal study. Diabetes Care 2006;29:2072–2077. PMID: 16936155.
crossref pmid
28. de Boer IH. DCCT/EDIC Research Group. Kidney disease and related findings in the diabetes control and complications trial/epidemiology of diabetes interventions and complications study. Diabetes Care 2014;37:24–30. PMID: 24356594.
crossref pmid pmc
29. Chiarelli F, Trotta D, Verrotti A, Mohn A. Treatment of hypertension and microalbuminuria in children and adolescents with type 1 diabetes mellitus. Pediatr Diabetes 2002;3:113–124. PMID: 15016166.
crossref pmid
Fig. 1

Schematic representation of diabetic patients with persistent, regression, and progression groups to microalbuminuria. T1DM, type 1 diabetes mellitus; T2DM, type 2 diabetes mellitus.

apem-20-13-g001.jpg
Fig. 2

Comparison of spot urine microalbumin/creatinine ratio between baseline and follow-up assessment. The median is depicted by the horizontal line, the interquartile range by the box limits, ranges by the whiskers, and outliers by the circles.

apem-20-13-g002.jpg
Table 1.

Anthropometric and laboratory characteristics of patients with type 1 and type 2 diabetes

Variable T1DM (n=109)
T2DM (n=18)
Baseline Follow-up Baseline Follow-up
Anthropometric index
 Age (yr) 17.5a)(15.1–20.5) 18.9 (16.5–21.0) 15.4a)(12.6–17.4) 17.9 (16.8–18.4)
 Sex, male/female 39/70 4/14
 Diabetes duration (yr) 9.5a)(6.5–13.5) 10.1 (7.8–14.0) 0.9a)(0.0–3.0) 5.0 (3.5–5.6)
 Height (cm) 162.0a)(160.0–170.0) 162.9 (160.0–172.0) 158.5a)(153.5–160.5) 160.2 (153.5–163.2)
 Weight (kg) 57.0a)(53.0–64.0) 58.5 (54.0–65.0) 61.0 (54.0–73.7) 63.4 (54.0–75.5)
 BMI (kg/m2) 21.52a)(19.53–23.15) 21.91 (20.03–23.41) 24.74 (21.09–30.88) 24.31 (21.09–29.02)
 Height z-score 0.12a)(–0.44 to 1.19) 0.05 (–0.55 to 0.86) 0.50a)(–0.15 to 0.71) –0.10 (–1.45 to 0.13)
 Weight z-score 0.31 (–0.17 to 1.00) 0.27 (–0.17 to 1.02) 1.02a)(–0.01 to 2.50) 0.35 (–0.01 to 2.17)
 BMI z-score 0.31 (–0.43 to 0.78) 0.30 (–0.43 to 0.83) 1.29 (–0.02 to 2.49) 0.99 (–0.01 to 2.27)
Biochemical profiles
 Serum creatinine (mg/dL) 0.80 (0.70–0.90) 0.75 (0.69–0.85) 0.80 (0.60–0.90) 0.65 (0.60–0.76)
 eGFR (mL/min/1.73 m2) 125.7 (110.0–134.6) 127.9a)(118.8–136.1) 128.5 (109.9–156.3) 139.6 (129.0–152.1)
 Urine microalbumin/creatinine (mg/g) 9.4 (6.3–26.6) 13.3 (8.6–24.8) 25.3 (11.5–56.0) 17.7 (6.2–42.0)
 Cholesterol (mg/dL) 175.0 (167.0–230.0) 179.0 (163.0–206.0) 194.0 (161.0–231.0) 150.0 (139.0–222.0)
 TG (mg/dL) 79.0 (61.0–101.0) 74.0 (56.0–93.0) 105.0 (85.0–235.0) 92.0 (64.0–262.0)
 HDL-cholesterol (mg/dL) 58.0 (50.0–68.0) 60.0a)(52.0–68.0) 49.5 (43.0–52.0) 53.0 (45.0–59.0)
 HbA1c (%) 8.3 (7.3–9.6) 8.4 (7.4–9.6) 8.8 (6.9–12.2) 7.8 (6.2–11.7)
 C-peptide (ng/mL) 0.02 (0.015–0.039) 0.02 (0.015–0.018) 2.97a)(2.471–3.733) 1.96 (1.432–2.393)

Values are presented as median (interquartile range) or number.

T1DM, type 1 diabetes mellitus; T2DM, type 2 diabetes mellitus; BMI, body mass index; eGFR, estimated glomerular filtration rate; TG, triglyceride; HDL-cholesterol, high density lipoprotein cholesterol; HbA1c, glycosylated hemoglobin; C-peptide, connecting peptide.

a) P<0.005 for baseline vs. follow-up assessments.

Table 2.

Characteristics of patients with type 1 diabetes according to microalbuminuria status (n=109)

Characteristic Persistent (n=10)
Regression (n=13)
Progression (n=9)
Normal (n=77)
Baseline Follow-up Baseline Follow-up Baseline Follow-up Baseline Follow-up
Anthropometric index
 Age (yr) 17.8 (14.5-22.5) 19.2 (17.0-23.0) 17.0 (15.0-21.0) 20.0 (17.5-21.5) 19.0 (19.0-24.5) 20.0 (19.5-25.0) 17.5 (15.0-20.5) 18.0 (15.5-21.0)
 Sex, male/female 2/8 4/9 3/6 4/9
 Diabetes duration (yr) 12.0 (7.5-16.0) 12.8 (8.0-16.5) 10.0 (5.0-11.1) 10.5 (7.9-13.0) 11.5 (5.5-15.0) 12.0 (7.5-16.0) 9.5 (6.5-13.5) 10.0 (7.0-14.0)
 Follow-up duration (yr) 0.5 (0.5-1.0)a) 1.0 (0.5-4.0) 0.5 (0.5–1.0)b) 1.0 (0.5-0.5)
 Height z-score 0.10 (-0.15-0.63) 0.11 (-0.15 to 0.53) -0.15 (-0.41 to 0.28) -0.22 (-0.55 to 0.26) 0.01 (-0.15 to 0.25) -0.01 (-0.15 to 0.25) 0.24 (-0.55 to 1.02) 0.15 (-0.55 to 0.86)
 Weight z-score 0.67 (0.32-1.13) 0.68 (0.04-1.02) 0.42 (-0.10-0.71) 0.22 (-0.09 to 1.13) 0.08 (-0.02 to 0.79) 0.08 (-0.02 to 0.79) 0.29 (-0.17 to 0.90) 0.29 (-0.17 to 0.90)
 BMI z-score 0.55 (0.28-0.83) 0.51 (0.12-0.83) 0.39 (-0.12 to 0.76) 0.34 (0.30-0.68) -0.04 (-0.47 to 0.77) -0.04 (-0.11 to 0.77) 0.28 (-0.50 to 0.59) 0.25 (-0.50 to 0.59)
Biochemical profiles
 sCr (mg/dL) 0.70 (0.60-0.90) 0.69 (0.65-0.74) 0.80 (0.70-1.00) 0.73 (0.69-0.99) 0.78 (0.60-0.80) 0.75 (0.74-0.81) 0.80 (0.70-0.90) 0.76 (0.69-0.86)
 eGFR (mL/min/1.73 m2) 127.7 (110.0-165.0) 129.5 (125.3-156.6) 116.3 (99.4-127.3) 128.3 (119.3-135.4) 117.3 (116.9-148.5) 118.8 (116.5-128.8) 125.7 (110.0-133.6) 127.5 (117.0-136.1)
 Urine microalbumin/creatinine (mg/g) 63.3 (48.9-171.8) 58.0 (48.0-92.4) 56.4 (34.1-74.0) 9.6 (8.6-15.8) 15.4 (11.4-22.0) 42.1 (30.8-50.2) 7.4 (5.0-10.1) 11.3 (7.8-16.5)
 Cholesterol (mg/dL) NA NA 175.0 (160.0-214.0) 168.0 (163.0-206.0) NA NA 181.0 (175.0-187.0) 177.5 (160.0-195.0)
 TG (mg/dL) 70.0 (64.0-135.0) 75.0 (68.0-119.0) 79.5 (67.0-109.0) 77.5 (73-94) 92.0 (81-94) 71.0 (61-89) 76.0 (56-99) 67.0 (53-91)
 HDL-cholesterol (mg/dL) 58.0 (56.0-64.0) 55.0 (53.0-66.0) 58.0 (53.0-67.0) 61.5 (55.0-68.0) 56.0 (45.0-68.0) 60.0 (47.0-75.0) 58.0 (49.0-67.0) 60.0 (52.0-68.0)
 HbA1c (%) 9.8 (8.7-13.8)c) 9.7 (8.9-10.1)d) 8.0 (7.0-8.9)e) 8.0 (7.1-9.4)f) 9.6 (8.5-10.2) 9.5 (7.8-10.1) 8.2 (7.1-9.1) 8.1 (7.2-9.0)
 C-peptide (ng/mL) 0.02 (0.015-0.015) 0.02 (0.015-0.018) 0.27 (0.015-0.571)g) 0.02 (0.020-0.050) 0.03 (0.015-0.100)h) 0.04 (0.020-0.092) 0.02 (0.015-0.020) 0.02 (0.015-0.022)

Values are presented as median (interquartile range or range) or number.

T1DM, type 1 diabetes mellitus; BMI, body mass index; sCr, serum creatinine; eGFR, estimated glomerular filtration rate; TG, triglyceride; HDL-cholesterol, high density lipoprotein cholesterol; HbA1c, glycosylated hemoglobin; C-peptide, connecting peptide; NA, not available.

a) P<0.001 for regression vs. persistent groups.

b) P=0.027 for regression vs. progression groups.

c) P=0.009 for persistent, regression, progression and normoalbuminuria groups.

d) P=0.030 for persistent, regression and progression groups.

e) P=0.026 for persistent vs. regression groups.

f) P=0.042 for persistent vs. regression groups.

g) P=0.021 for persistent vs. regression groups.

h) P=0.021 for persistent vs. progression groups.

Table 3.

Characteristics of patients with type 2 diabetes according to microalbuminuria status (n=18)

Characteristic Persistent (n=5)
Regression (n=3)
Progression (n=2)
Normoalbuminuria (n=8)
Baseline Follow-up Baseline Follow-up Baseline Follow-up Baseline Follow-up
Anthropometric index
 Age (yr) 14.9 (13.3-16.8) 17.9 (17.8-18.1) 14.1 (11.9-26.0) 18.2 (13.8-27.0) 18.9 (15.8-22.0) 19.7 (16.8-22.5) 14.4 (12.3-17.4) 17.0 (15.8-18.4)
 Sex, male/female 0/3 0/5 0/2 4/4
 Diabetes duration (yr) 2.6 (0.2-3.0) 5.6 (5.3-6.6) 0.0 (0.0-13.0) 4.1 (1.9-14.0) 2.3 (0.5-4.0) 3.0 (1.0-5.0) 0.7 (0.0-3.0) 4.6 (3.2-5.1)
 Follow-up duration (yr) 4.4 (3.0-5.1) 1.9 (1.0-4.1) 0.8 (0.5-1.0) 2.6 (0.5-5.0)
 Height z-score 0.00 (-0.02 to 0.01)a) -0.02 (-1.45 to -0.01) -0.15 (-0.55 to 0.05) -0.63 (-0.79 to -0.15) -1.92 (-2.23 to -1.60) -1.92 (-2.23 to -1.61) 0.65 (0.46-0.98) 0.12 (-0.70 to 0.47)
 Weight z-score 2.33 (1.18-2.50) 1.56 (1.47-2.38) -0.15 (-2.16 to -0.02) -0.02 (-3.07-0.04) 0.20 (0.13-0.27) 0.20 (0.13-0.27) 1.74 (0.31-2.68) 0.63 (-0.01 to 2.29)
 BMI z-score 2.10 (1.28-2.85) 2.27 (1.57-2.35) -0.26 (-2.39 to -0.02) -0.02 (-2.97 to 0.49) 1.16 (1.00-1.31) 1.13 (0.94-1.31) 1.83 (-0.07 to 2.57) 0.99 (-0.16 to 2.27)
Biochemical profiles
 sCr (mg/dL) 0.80 (0.58-0.90) 0.59 (0.49-0.64) 0.80 (0.52-1.10) 0.62 (0.55-0.76) 0.63 (0.60-0.65) 0.71 (0.66-0.76) 0.85 (0.65-0.90) 0.75 (0.61-0.81)
 eGFR (mL/min/1.73 m2) 110.3 (99.3-151.9) 152.1 (131.8-180.4) 115.8 (77.5-158.7) 136.2 (110.0-157.5) 132.9 (128.2-137.5) 117.7 (108.6-126.8) 131.3 (109.9-181.5) 145.2 (131.1-148.6)
 Urine microalbumin/creatinine (mg/g) 63.48 (40.18-117.46) 68.59 (42.04-72.26) 56.00 (34.29-241.43) 15.29 (13.23-20.02) 6.21 (3.55-8.88) 38.76 (30.20-47.32) 13.16 (9.29-21.32) 5.96 (3.83-9.13)
 Cholesterol (mg/dL) 218.0 (194-253) 209.0 (147-338) 196.0 (161-231) 174.0 (160-188) NA NA 162.0 (136-165) 139.0 (136-141)
 TG (mg/dL) 295.0 (179-581)b) 326.0 (320-572)c) 87.0 (85-251) 95.0 (60-149) 181.0 (127-235) 215.0 (168-262) 68.5 (55-106) 64.0 (60-82)
 HDL-cholesterol (mg/dL) 52.0 (51-52) 54.0 (45-57) 64.0 (41-73) 59.0 (44-64) 39.5 (35-44) 43.5 (41-46) 47.5 (43-50) 53.0 (45-66)
 HbA1c (%) 11.2 (7.0-12.2) 11.1 (8.2-12.3) 13.3 (7.6-15.0) 6.3 (6.1-12.1) 6.7 (6.1-7.3) 7.8 (6.4-9.2) 8.3 (5.6-11.1) 6.6 (5.4-11.7)
 C-peptide (ng/mL) 3.73 (2.710-3.750) 2.25 (1.960-3.100) 2.08 (1.010-2.230) 2.43 (1.420-3.440) 3.41 (2.470-4.340) 1.83 (1.270-2.390) 3.00 (2.970-3.200) 1.63 (1.180-2.130)

Values are presented as median (interquartile range or range) or number.

T2DM, type 2 diabetes mellitus; BMI, body mass index; sCr, serum creatinine; eGFR, estimated glomerular filtration rate; TG, triglyceride; HDL-cholesterol, high density lipoprotein cholesterol; HbA1c, glycosylated hemoglobin; C-peptide, connecting peptide; NA, not available.

a) P=0.014 for persistent vs. regression, progression groups.

b) P=0.040 for persistent, regression, progression and normoalbuminuria groups.

c) P=0.012 for persistent, regression, progression and normoalbuminuria groups.


ABOUT
ARTICLE CATEGORY

Browse all articles >

BROWSE ARTICLES
AUTHOR INFORMATION
Editorial Office
501-107, 30 Seocho-daero 74-gil, Seocho-gu, Seoul 06622, Republic of Korea
Tel: +82-2-3471-4268    Fax: +82-2-3471-4269    E-mail: kspe.editor@gmail.com                

Copyright © 2024 by Korean Society of Pediatric Endocrinology.

Developed in M2PI

Close layer
prev next